
Mathematics, 24.02.2020 05:19 izzyisawesome5232
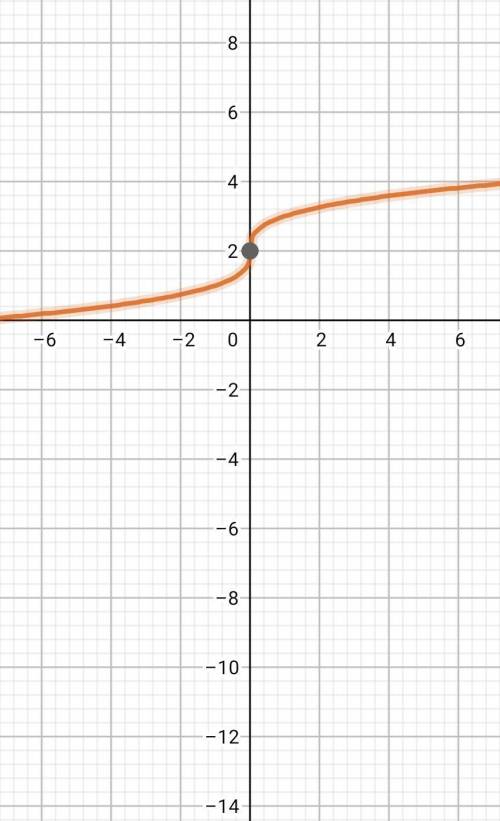
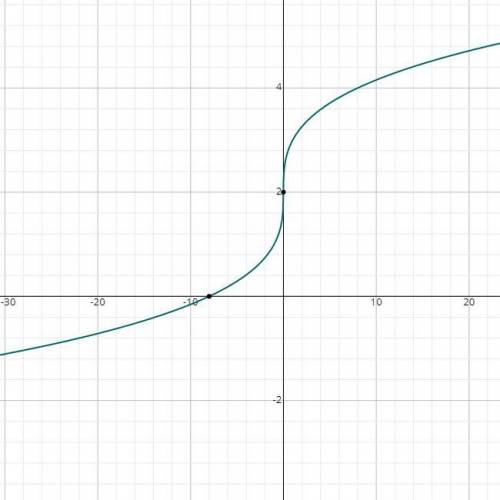
Which graph represents y = RootIndex 3 StartRoot x EndRoot + 2?

Answers: 3
![y = \sqrt[3]{x} + 2](/tpl/images/0520/9848/0acbb.png)
![y = \sqrt[3]{x}](/tpl/images/0520/9848/e4282.png)
![y=\sqrt[3]{x}+2](/tpl/images/0520/9848/72fe7.png)
![\mathrm{Domain\:of\:}\:\sqrt[3]{x}+2\::\quad \begin{bmatrix}\mathrm{Solution:}\:&\:-\infty \:](/tpl/images/0520/9848/afcff.png)
![\mathrm{Range\:of\:}\sqrt[3]{x}+2:\quad \begin{bmatrix}\mathrm{Solution:}\:&\:-\infty \:](/tpl/images/0520/9848/3593b.png)
![\mathrm{Axis\:interception\:points\:of}\:\sqrt[3]{x}+2:\quad \mathrm{X\:Intercepts}:\:\left(-8,\:0\right),\:\mathrm{Y\:Intercepts}:\:\left(0,\:2\right)](/tpl/images/0520/9848/0ecf2.png)
![\mathrm{Asymptotes\:of}\:\sqrt[3]{x}+2:\quad \mathrm{None}](/tpl/images/0520/9848/43ec0.png)
![\mathrm{Extreme\:Points\:of}\:\sqrt[3]{x}+2:\quad \mathrm{Saddle}\left(0,\:2\right)](/tpl/images/0520/9848/efe93.png)


Another question on Mathematics
Mathematics, 21.06.2019 18:30
Do some research and find a city that has experienced population growth. determine its population on january 1st of a certain year. write an exponential function to represent the city’s population, y, based on the number of years that pass, x after a period of exponential growth. describe the variables and numbers that you used in your equation.
Answers: 3
Mathematics, 21.06.2019 19:00
Human body temperatures have a mean of 98.20° f and a standard deviation of 0.62°. sally's temperature can be described by z = 1.4. what is her temperature? round your answer to the nearest hundredth. 99.07°f 97.33°f 99.60°f 100.45°f
Answers: 1
Mathematics, 21.06.2019 20:00
Find the slope of the line passing through a pair of points
Answers: 2
You know the right answer?
Which graph represents y = RootIndex 3 StartRoot x EndRoot + 2?...
Questions
Mathematics, 09.04.2021 20:20
Mathematics, 09.04.2021 20:20
Mathematics, 09.04.2021 20:20
Mathematics, 09.04.2021 20:20
Mathematics, 09.04.2021 20:20

Mathematics, 09.04.2021 20:20

Mathematics, 09.04.2021 20:20

Chemistry, 09.04.2021 20:20
Mathematics, 09.04.2021 20:20


