
Mathematics, 04.03.2020 06:26 djennings8055
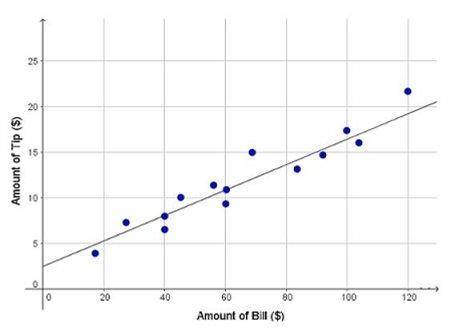
The graph shows the tip amount that 14 different customers left, based on the their bill. A trend line has been drawn for the data. The equation for the line is: y = 0.14x + 2.5. Which BEST interprets the slope of the linear model? .
A) A $1 increase in the bill is associated with a $2.50 increase in tip amount.
B) A $2.50 increase in the bill is associated with a $1 increase in tip amount.
C) A $0.14 increase in the bill is associated with a $1 increase in tip amount.
D) A $1 increase in the bill is associated with a $0.14 increase in tip amount.

Answers: 3


Another question on Mathematics
Mathematics, 21.06.2019 14:30
Which expression is equivalent to (3^2)^-2 a.-81 b.-12 c.1/81 d.1/12
Answers: 2
Mathematics, 21.06.2019 19:50
How do i simply this expression (quadratic formula basis) on a ti-84 or normal calculator?
Answers: 3
You know the right answer?
The graph shows the tip amount that 14 different customers left, based on the their bill. A trend li...
Questions


Business, 16.12.2020 16:10

Computers and Technology, 16.12.2020 16:10


Engineering, 16.12.2020 16:10
Mathematics, 16.12.2020 16:10
Computers and Technology, 16.12.2020 16:10


