Please HELP ME
Look at the graph below:
Which part of the graph best represents the...

Mathematics, 12.03.2020 00:00 jabezslade22
Please HELP ME
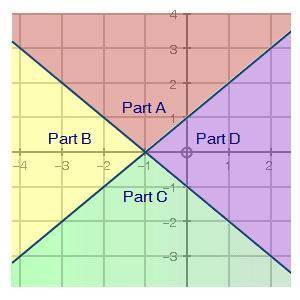
Look at the graph below:
Which part of the graph best represents the solution set to the system of inequalities y ≥ x + 1 and y + x ≥ −1? (5 points)
Part A
Part B
Part C
Part D

Answers: 1


Another question on Mathematics
Mathematics, 21.06.2019 19:30
Me. i can't figure out this question. give an explanation too. .
Answers: 1
Mathematics, 21.06.2019 22:00
The numbers on a football field indicate 10 yard increments. you walk around the perimeter of a football field between the pylons. you walk a distance of 30623 yards. find the area and perimeter of the indicated regions. write your answers as mixed numbers, if necessary. a. one end zone: perimeter: yd area: yd2 b. the playing field (not including end zones): perimeter: yd area: yd2 c. the playing field (including end zones): perimeter: yd area: yd2
Answers: 1
Mathematics, 22.06.2019 02:30
Find the value of x to the nearest tenth. a. 4.5 b. 5.4 c. 6.3 d. 7.2
Answers: 1
You know the right answer?
Questions
Mathematics, 16.01.2021 08:40
Mathematics, 16.01.2021 08:40


Mathematics, 16.01.2021 08:40
Mathematics, 16.01.2021 08:40
Mathematics, 16.01.2021 08:40


Business, 16.01.2021 08:40

Mathematics, 16.01.2021 08:40
English, 16.01.2021 08:40

Mathematics, 16.01.2021 08:40
History, 16.01.2021 08:40


