
Mathematics, 13.03.2020 19:54 damienwoodlin6
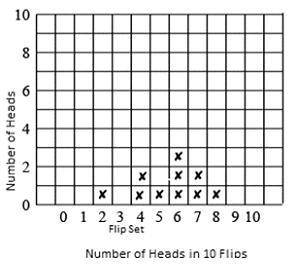
1. Draw a histogram from all the data. Starting at the bottom row, for each set of 10 flips, place an “x” in the column corresponding to the number of heads that set produced. Your histogram should look similar to the example below:
2. Calculate the mean and standard deviation.
mean = _, standard deviation = _
3. Calculate the percent of the data that is within 1, 2, and 3 standard deviations of the mean.
within 1 standard deviation = _%
within 2 standard deviations = _%
within 3 standard deviations = _%
4. Compare your results to a normal distribution. Interpret any differences.

Answers: 2


Another question on Mathematics
Mathematics, 21.06.2019 17:30
Write an expression that has three terms and simplifies to 4x - 7. identify the coefficient(s) and constant(s) in your expression
Answers: 1
Mathematics, 21.06.2019 23:00
Janie has $3. she earns $1.20 for each chore she does and can do fractions of chores. she wants to earn enough money to buy a cd for $13.50.
Answers: 2
Mathematics, 22.06.2019 00:00
To convert celsius temperatures to fahrenheit, you can use the expression (c + 32). tom says that another way to write this expression is c + 32. what error did tom make?
Answers: 3
You know the right answer?
1. Draw a histogram from all the data. Starting at the bottom row, for each set of 10 flips, place a...
Questions


History, 23.10.2019 22:30


