
Mathematics, 20.03.2020 01:26 bbrid8590
"Time headway" in traffic flow is the elapsed time between the time that one car finishes passing a fixed point and the instant that the next car begins to pass that point. Let X = the time headway for two randomly chosen consecutive cars on a freeway during a period of heavy flow (sec). Suppose that in a particular traffic environment, the distribution of time headway has the following form.
f(x) = k/(x^7) ; x > 1
0 ; x<1
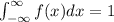
a. Determine the value of K for which f(x) is a legitimate pdf
b. Obtain the cumulative distribution function
F(x) = [ Blank ] ; x > 1
0 ; x < 1
c. Use the cdf from (b) to determine the probability that headway exceeds 2 sex. (Round your answer to three decimal places.)
Use the cdf from (b) to determine the probability that headway is between 2 and 3 sec (round your answer to three decimal places)
d. Obtain the mean value of headway and the standard deviation of headway. (Roun to nearest 3 decimal places)
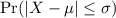
e. What is the probability that headway is within 1 standard deviation of the mean value?

Answers: 1
 . Then,
 Then, F(x) =0 if
  . Then if x>1 we have from the previous point that
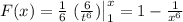


![\mu = \text{E}(X), \sigma = \sqrt[]{\text{E}(X^2)-\text{E}(X)^2}](/tpl/images/0555/0754/fb567.png) . Where,
. Where, 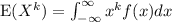


![\sqrt[]{\frac{6}{6-2}-1.2^2}= \sqrt[]{1.5-1.2^2} = 0.245](/tpl/images/0555/0754/2e694.png) .
. Which is equivalent to


Another question on Mathematics
Mathematics, 21.06.2019 18:30
Need an artist designed a badge for a school club. figure abcd on the coordinate grid below shows the shape of the badge: the badge is enlarged and plotted on the coordinate grid as figure jklm with point j located at (2, -2) and point m is located at (5, 4). which of these could be the coordinates for point l? a. (2, 4) b. (8, 4) c. (5, 1) d. (5, 7)
Answers: 2
Mathematics, 21.06.2019 20:20
Consider the following estimates from the early 2010s of shares of income to each group. country poorest 40% next 30% richest 30% bolivia 10 25 65 chile 10 20 70 uruguay 20 30 50 1.) using the 4-point curved line drawing tool, plot the lorenz curve for bolivia. properly label your curve. 2.) using the 4-point curved line drawing tool, plot the lorenz curve for uruguay. properly label your curve.
Answers: 2
Mathematics, 21.06.2019 21:30
Create a graph for the demand for starfish using the following data table: quantity/price of starfish quantity (x axis) of starfish in dozens price (y axis) of starfish per dozen 0 8 2 6 3 5 5 2 7 1 9 0 is the relationship between the price of starfish and the quantity demanded inverse or direct? why? how many dozens of starfish are demanded at a price of five? calculate the slope of the line between the prices of 6 (quantity of 2) and 1 (quantity of 7) per dozen. describe the line when there is a direct relationship between price and quantity.
Answers: 3
You know the right answer?
"Time headway" in traffic flow is the elapsed time between the time that one car finishes passing a...
Questions
Mathematics, 20.08.2019 19:30


Geography, 20.08.2019 19:30

Social Studies, 20.08.2019 19:30

Social Studies, 20.08.2019 19:30
History, 20.08.2019 19:30
Mathematics, 20.08.2019 19:30
Biology, 20.08.2019 19:30
History, 20.08.2019 19:30


