
Mathematics, 22.04.2020 00:27 demarcuswiseman
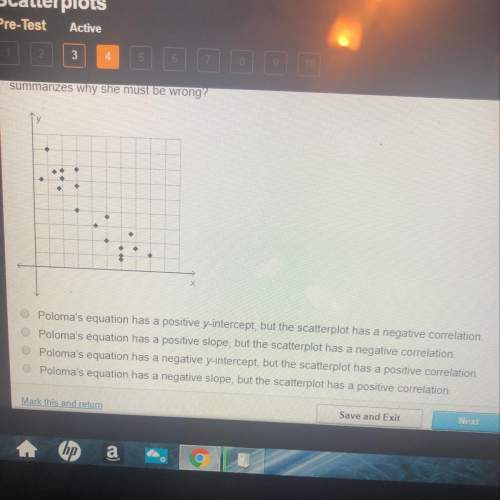
Write positive, negative, or none to describe the correlation illustrated by the scatter plot you drew in problem 1. Estimate the value of the correlation coefficient, r. Indicate whether r is closer to −1, −0.5, 0, 0.5, or 1

Answers: 1


Another question on Mathematics
Mathematics, 21.06.2019 15:30
The table below represents a linear function f(x) and the equation represents a function g(x): x f(x) −1 −5 0 −1 1 3 g(x) g(x) = 2x − 7 part a: write a sentence to compare the slope of the two functions and show the steps you used to determine the slope of f(x) and g(x). (6 points) part b: which function has a greater y-intercept? justify your answer. (4 points)
Answers: 3
Mathematics, 22.06.2019 01:00
Which is an accurate comparison of the two data sets? the commute to work is typically shorter and more consistent than the commute home. the commute to work is typically shorter but less consistent than the commute home. the commute to work is typically longer and less consistent than the commute home. the commute to work is typically longer but more consistent than the commute home.
Answers: 2
Mathematics, 22.06.2019 02:50
Analyze the diagram below and complete the instructions that follow. 56 find the unknown side length, x write your answer in simplest radical form. a 2047 b. 60 c. sv109 d. 65 save and exit next s and return
Answers: 1
Mathematics, 22.06.2019 03:00
Find four solutions of the given function. write the solutions as ordered pairs. 4x – y = 4
Answers: 1
You know the right answer?
Write positive, negative, or none to describe the correlation illustrated by the scatter plot you dr...
Questions

English, 25.01.2021 05:20

History, 25.01.2021 05:20
Mathematics, 25.01.2021 05:20
Mathematics, 25.01.2021 05:20
Mathematics, 25.01.2021 05:20
Mathematics, 25.01.2021 05:20


Social Studies, 25.01.2021 05:20

Medicine, 25.01.2021 05:20
Mathematics, 25.01.2021 05:20

German, 25.01.2021 05:20
Mathematics, 25.01.2021 05:20


