
Mathematics, 21.05.2020 23:57 SkinnestXOXO
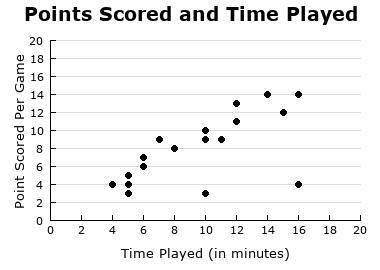
The scatter plot shows the amount of time Oscar played and the number of points he scored during each basketball game. Which describes the association of the variables in the data?
A)
no association
B)
nonlinear association
C)
positive, linear association
D)
negative, linear association

Answers: 3


Another question on Mathematics
Mathematics, 21.06.2019 17:30
Which equation represents a line that is parallel to the line whose equation is 3x-2y=7( show all work)
Answers: 3
Mathematics, 21.06.2019 20:00
Sarah took the advertising department from her company on a round trip to meet with a potential client. including sarah a total of 11 people took the trip. she was able to purchase coach tickets for $280 and first class tickets for $1280. she used her total budget for airfare for the trip, which was $6080. how many first class tickets did she buy? how many coach tickets did she buy?
Answers: 1
Mathematics, 21.06.2019 23:30
Solve this 364x-64x=300x and 12(x2–x–1)+13(x2–x–1)=25(x2–x–1)
Answers: 1
Mathematics, 22.06.2019 00:00
Layla answer 21 of the 25 questions on his history test correctly.what decimal represents the fraction of problem he answer incorrectly.
Answers: 1
You know the right answer?
The scatter plot shows the amount of time Oscar played and the number of points he scored during eac...
Questions

Computers and Technology, 27.11.2019 01:31


Social Studies, 27.11.2019 01:31

Computers and Technology, 27.11.2019 01:31


