Mathematics, 05.07.2020 01:01 charitysamuels
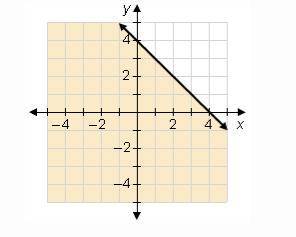
The graph shows which inequality? The equation of the boundary line is y = –x + 4. y –x + 4 y ≥ –x + 4


Answers: 3


Another question on Mathematics

Mathematics, 20.06.2019 18:04
Itook a better photo of the question so y’all can see it i hope it’s a fine photo
Answers: 1

Mathematics, 21.06.2019 17:30
Describe the 2 algebraic methods you can use to find the zeros of the function f(t)=-16t^2+400.
Answers: 3

Mathematics, 21.06.2019 22:30
The track team ran a mile and a quarter during their practice how many kilometers did her team runs?
Answers: 1

Mathematics, 22.06.2019 00:00
Me with this assignment ! i only partially understand, so explain. also it's a work sample. at the championship bike race, steve and paula were fighting for first place. steve was 175 feet ahead of paula and had only 300 feet left to go. he was very tired and was going only 9 feet per second. paula was desperate to catch up and was going 15 feet per second. who won the bike race and by how far did she/he win?
Answers: 1
You know the right answer?
The graph shows which inequality? The equation of the boundary line is y = –x + 4. y –x + 4 y ≥ –x +...
Questions


Mathematics, 08.04.2021 03:30

Mathematics, 08.04.2021 03:30


English, 08.04.2021 03:30

Mathematics, 08.04.2021 03:30

English, 08.04.2021 03:30


Mathematics, 08.04.2021 03:30


Mathematics, 08.04.2021 03:30


Mathematics, 08.04.2021 03:30

History, 08.04.2021 03:30


Mathematics, 08.04.2021 03:30


