
Mathematics, 29.07.2020 21:01 callofdutyghostgamer
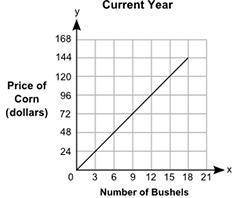
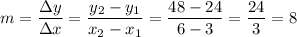
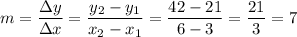
HELP PLEASE 40 POINTS The graph shows the prices of different numbers of bushels of corn at a store in the current year. The table shows the prices of different numbers of bushels of corn at the same store in the previous year. A graph shows Number of Bushels on x-axis and Price of Corn in dollars on y-axis. The x-axis scale is shown from 0 to 21 at increments of 3, and the y-axis scale is shown from 0 to 168 at increments of 24. A straight line joins the ordered pairs 3, 24 and 6, 48 and 9, 72 and 12, 96 and 15, 120 and 18, 144. Previous Year Number of Bushels Price of Corn (dollars) 3 21 6 42 9 63 12 84 Part A: Describe in words how you can find the rate of change of a bushel of corn in the current year, and find the value. Part B: How many dollars more is the price of a bushel of corn in the current year than the price of a bushel of corn in the previous year? Show your work. AND IT IS NOT QUESTION AND ANSWER PLEASE LOOK AT THE GRAPH AND READ THE PARAGRAPH

Answers: 3


Another question on Mathematics
Mathematics, 21.06.2019 20:40
Michelle is planting flowers in her garden. she wants the ratio of daises to carnations to be 3 to 2. michelle wants to plant a total of 35 flowers. how many daises should she plant?
Answers: 3
Mathematics, 21.06.2019 22:00
Find two consexutive odd integers such that the sum of their square is 650
Answers: 2
Mathematics, 21.06.2019 22:30
Shannon drove for 540 minutes. if she traveled 65 miles per hour,how many total miles did she travel?
Answers: 2
Mathematics, 22.06.2019 03:00
M∠abc=138° and m∠def=31° . which statement is true about ∠abc and ∠def ? a: the angles are neither complementary nor supplementary. b: the angles are complementary. c: the angles are supplementary.
Answers: 1
You know the right answer?
HELP PLEASE 40 POINTS The graph shows the prices of different numbers of bushels of corn at a store...
Questions


Computers and Technology, 21.04.2020 15:33


Mathematics, 21.04.2020 15:33


