
Mathematics, 03.09.2020 22:01 lilacastro
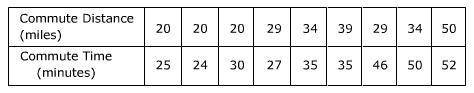
The data in the table show how long (in minutes, t) it takes several commuters to drive to work. Find the correlation coefficient and the equation of the line of best fit for the data. Treat the commute distance d as the independent variable. A. r ≈ 0.75 t ≈ 0.8d + 11.5 B. r ≈ 0.56 t ≈ 0.8d + 11.5 C. r ≈ 0.56 t ≈ 0.7d + 5.5 D. r ≈ 0.75 t ≈ 0.7d + 5.5

Answers: 3


Another question on Mathematics
Mathematics, 21.06.2019 13:00
How can we find the measure of an exterior angle if we know the measurement of an interior angle
Answers: 1
Mathematics, 21.06.2019 17:00
Asocial networking site currently has 400,000 active members, and that figure is predicted to increase by 32% each year. the following expression represents the number of active members on the site after t years.
Answers: 1
Mathematics, 21.06.2019 22:30
James wants to promote his band on the internet. site a offers website hosting for $4.95 per month with a $49.95 startup fee. site b offers website hosting for $9.95 per month with no startup fee. for how many months would james need to keep the website for site a to be a better choice than site b?
Answers: 1
You know the right answer?
The data in the table show how long (in minutes, t) it takes several commuters to drive to work. Fin...
Questions

English, 27.04.2021 01:20

Mathematics, 27.04.2021 01:20


Chemistry, 27.04.2021 01:20
Mathematics, 27.04.2021 01:20
Mathematics, 27.04.2021 01:20
Mathematics, 27.04.2021 01:20

Computers and Technology, 27.04.2021 01:20


