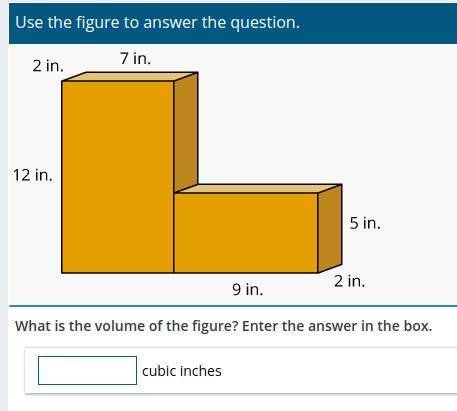
Find the volume! Help!!
...

Answers: 2


Another question on Mathematics

Mathematics, 21.06.2019 16:00
The scatter plot graph shows the average annual income for a certain profession based on the number of years of experience which of the following is most likely to be the equation of the trend line for this set of data? a. i=5350e +37100 b. i=5350e-37100 c. i=5350e d. e=5350e+37100
Answers: 1
Mathematics, 22.06.2019 00:00
During the election for class president, 40% of the students voted for kellen, and 60% of the students voted for robbie. 500 students voted in total. how many more students voted for robbie than for kellen? answer with work : )
Answers: 1
Mathematics, 22.06.2019 01:30
Find the circumference of a pizza with a diameter of 10 inches round to the nearest tenth
Answers: 1
You know the right answer?
Questions

History, 25.05.2021 20:30


English, 25.05.2021 20:30


Mathematics, 25.05.2021 20:30

Computers and Technology, 25.05.2021 20:30


