
Mathematics, 02.10.2020 09:01 connermichaela
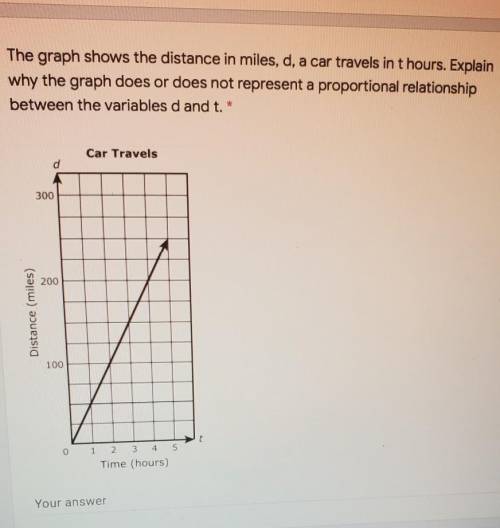
The graph shows the distance in miles, d, a car travels in t hours. Explain why the graph does or does not represent a proportional relationship between the variables d and t?

Answers: 2


Another question on Mathematics
Mathematics, 21.06.2019 21:00
Two cars which are 40 miles apart start moving simultaneously in the same direction with constant speeds. if the speed of the car which is behind is 56 mph and the speed of the other car is 48 mph, how many hours will it take for the car which is behind to catch up the car ahead of it?
Answers: 2
Mathematics, 21.06.2019 23:00
What is the sum of the first 8 terms of the geometric series
Answers: 3
Mathematics, 22.06.2019 02:30
Aliter of water contains about 3.35 x 10^25 molecules. a certain river discharges about 2.9x 10^8 l of water every second. about how many molecules does the river discharge every minute? write your answer in scientific notation
Answers: 1
Mathematics, 22.06.2019 03:00
The blue segment below is a diameter of o. what is the length of the radius of the circle?
Answers: 1
You know the right answer?
The graph shows the distance in miles, d, a car travels in t hours. Explain why the graph does or do...
Questions


History, 06.04.2021 05:10


Health, 06.04.2021 05:10

Biology, 06.04.2021 05:10
Mathematics, 06.04.2021 05:10
Physics, 06.04.2021 05:10


