
Mathematics, 12.10.2020 19:01 joannegrace869
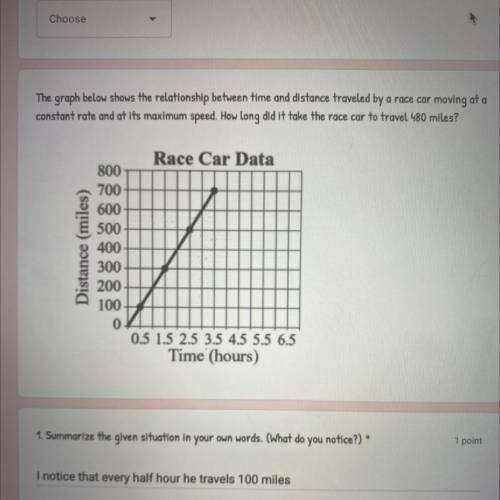
The graph below shows the relationship between time and distance traveled by a race car moving at a
constant rate and at its maximum speed. How long did it take the race car to travel 480 miles?
Race Car Data
Distance (miles)
800
700
600
500
400
300
200
100
0
0.5 1.5 2.5 3.5 4.5 5.5 6.5
Time (hours)

Answers: 2
 is given as:


Another question on Mathematics
Mathematics, 21.06.2019 16:30
Mexico city, mexico, is the world's second largest metropolis and is also one of its fastest-growing cities with a projected growth rate of 3.2% per year. its population in 1991 was 20,899,000 people. use the formula p = 20.899e0.032t to predict its population p in millions with t equal to the number of years after 1991. what is the predicted population to the nearest thousand of mexico city for the year 2010?
Answers: 2
Mathematics, 21.06.2019 23:30
Xy x xy if a and b are positive integers such that a*b=9 and b*a=72 what is the value of a/b
Answers: 3
Mathematics, 22.06.2019 02:30
$30 to spend on dinner tax and gratuity at mos restaurant rax is 6% and they give a 15% tip on the total bill after taxes thier dinner cost $21 which statement correctly explains wether andrew and kate have enough money to pay their bill
Answers: 1
Mathematics, 22.06.2019 03:00
Which is the factored form of the polynomial p(x) shown here?
Answers: 1
You know the right answer?
The graph below shows the relationship between time and distance traveled by a race car moving at a...
Questions


