Mathematics, 12.10.2020 19:01 Kazya4
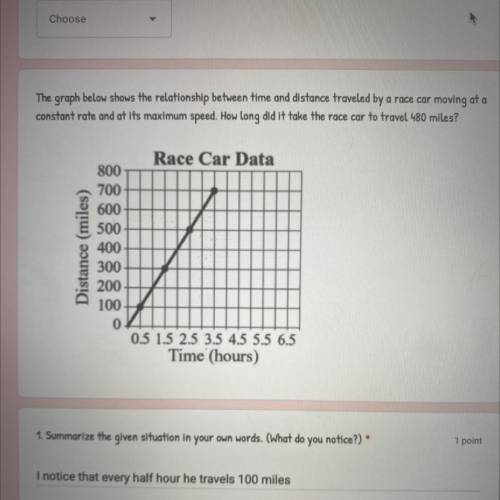
The graph below shows the relationship between time and distance traveled by a race car moving at a
constant rate and at its maximum speed. How long did it take the race car to travel 480 miles?
Race Car Data
Distance (miles)
800
700
600
500
400
300
200
100
0
0.5 1.5 2.5 3.5 4.5 5.5 6.5
Time (hours)


Answers: 1


Another question on Mathematics

Mathematics, 21.06.2019 17:30
Daniel bought a computer game for $25 and later sold it to thomas for a 40% profit. how much did daniel sell the computer game for?
Answers: 1

Mathematics, 21.06.2019 22:20
The school track has eight lanes. each lane is 1.25 meters wide. the arc at each end of the track is 180. the distance of the home straight and the radii for the arcs in the 1st 4 lanes are given. s=85m r1=36.5m r2=37.75m r3=39m r4=40.25m part one: find the radii of lanes 5 through 8 of the track. show your work. part two: if max ran around lane one, how far did he run? show your work and explain your solution. part three: max wants to run a total of three laps around the track, choose two additional lanes (2-8) for him to run and find the distance around those two lanes. show your work and round to the hundredths. part 4: based on your lane choices in part three, what was the total distance max ran in the three laps around the track?
Answers: 2

Mathematics, 21.06.2019 22:30
Using the figure below, select the two pairs of alternate interior angles.a: point 1 and point 4 b : point 2 and point 3 c: point 6 and point 6d: point 5 and point 7
Answers: 2

Mathematics, 21.06.2019 22:30
The ivring berlin learning center would like a possible net profit of $650,000 on its new resource manual it sells to schools. the fixed costs for producing the manual are $780,000 and the variable cost per package is $19.85. if the estimated unit sales are 1,250,000 units, what selling price unit should the ivring berlin learning center try?
Answers: 1
You know the right answer?
The graph below shows the relationship between time and distance traveled by a race car moving at a...
Questions


Mathematics, 28.01.2020 07:31


Mathematics, 28.01.2020 07:31


Mathematics, 28.01.2020 07:31


