16) Which of the following best represents the
range of the graph below?
A) -3 5 y 38
C...

Mathematics, 19.10.2020 14:01 potatocow
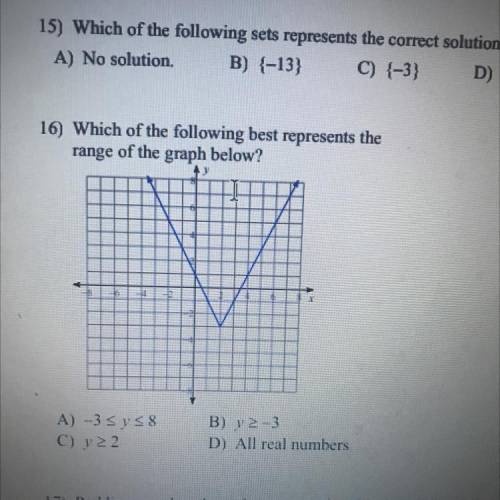
16) Which of the following best represents the
range of the graph below?
A) -3 5 y 38
C) y22
B) y2-3
D) All real numbers

Answers: 1


Another question on Mathematics
Mathematics, 21.06.2019 18:00
Name each raycalculation tip: in ray "ab", a is the endpoint of the ray.
Answers: 1
Mathematics, 21.06.2019 20:00
Solve for x and y a x= 13.3 y= 16.7 b x= 23.3 y= 12.5 c x= 7.5 y= 16.7 d x=7.5 y= 12.5
Answers: 1
Mathematics, 21.06.2019 20:00
In one day there are too high tides into low tides and equally spaced intervals the high tide is observed to be 6 feet above the average sea level after six hours passed a low tide occurs at 6 feet below the average sea level in this task you will model this occurrence using a trigonometric function by using x as a measurement of time assume the first high tide occurs at x=0. a. what are the independent and dependent variables? b. determine these key features of the function that models the tide: 1.amplitude 2.period 3.frequency 4.midline 5.vertical shift 6.phase shift c. create a trigonometric function that models the ocean tide for a period of 12 hours. d.what is the height of the tide after 93 hours?
Answers: 1
You know the right answer?
Questions


Mathematics, 15.10.2020 08:01


