
Mathematics, 20.10.2020 14:01 hateschool5207
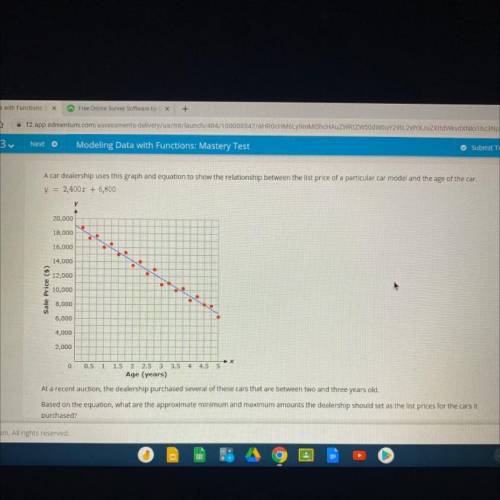
A car dealership uses this graph and equation to show the relationship between the list price of a particular car model and the age of the car.
y = 2,400x + 6,800
20,000
18,000
16,000
14,000
12,000
Sale Price (5)
10,000
8,000
6,000
4,000
2,000
0
4.5
S
0.5 11.5 2
2.5 3 3.5
Age (years)
At a recent auction, the dealership purchased several of these cars that are between two and three years old.
Based on the equation, what are the approximate minimum and maximum amounts the dealership should set as the list prices for the cars it
purchased?

Answers: 2


Another question on Mathematics
Mathematics, 21.06.2019 15:00
Need ! give step by step solutions on how to solve number one [tex]\frac{9-2\sqrt{3} }{12+\sqrt{3} }[/tex] number two [tex]x+4=\sqrt{13x-20}[/tex] number three (domain and range) [tex]f(x)=2\sqrt[3]{x} +1[/tex]
Answers: 3
Mathematics, 21.06.2019 19:00
Me with geometry ! in this figure, bc is a perpendicular bisects of kj. dm is the angle bisects of bdj. what is the measure of bdm? •60° •90° •30° •45°
Answers: 2
Mathematics, 21.06.2019 19:30
Select the margin of error that corresponds to the sample mean that corresponds to each population: a population mean of 360, a standard deviation of 4, and a margin of error of 2.5%
Answers: 2
You know the right answer?
A car dealership uses this graph and equation to show the relationship between the list price of a p...
Questions


Computers and Technology, 27.02.2020 00:30
Mathematics, 27.02.2020 00:31

Mathematics, 27.02.2020 00:31
Mathematics, 27.02.2020 00:31

English, 27.02.2020 00:31


Business, 27.02.2020 00:31
Mathematics, 27.02.2020 00:31
Social Studies, 27.02.2020 00:31


