
Mathematics, 02.11.2020 04:10 PrincesssOfficial
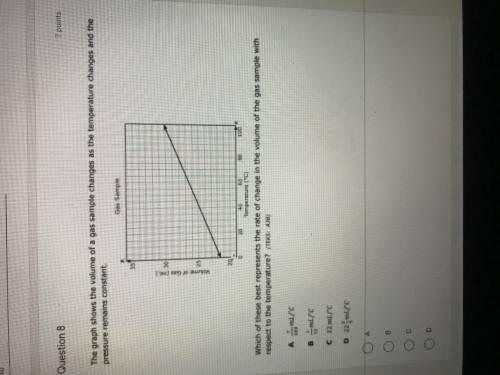
the graph shows the volume of a gas sample changes as the temperature changes and the pressure remains constant. which of these best represents the rate of change in the volume of the gas sample with respect to the temperature

Answers: 2


Another question on Mathematics
Mathematics, 21.06.2019 18:00
Aplane is taking off from bangladesh headed to new york city. at the same time, a plane from new york city is headed to bangladesh is also taking off. the plane bound to new york city is traveling at 600 mph, while the plane traveling to bangladesh is traveling at 400 mph. how far from new york city will the two planes meet if the distance between new york city and bangladesh is 8,000 miles?
Answers: 3
Mathematics, 22.06.2019 00:50
Melissa is purchasing a $160,000 home and her bank is offering her a 30-year mortgage at a 4.9% interest rate. in order to lower her monthly payment, melissa will make a 20% down payment and will purchase 3 points. what will her monthly mortgage payment be? a. $645.98 b. $650.46 c. $662.93 d. $606.69
Answers: 2
Mathematics, 22.06.2019 03:30
3a + 5b - 7 = 0 a - 2b - 4 = 0 solve the system by the elimination method. check your work {(96/11, -5/11)} {(34/11, -5/11)} {(32/33, 5/11)}
Answers: 1
Mathematics, 22.06.2019 05:00
A33.33 percent decrease followed by a 50% increase. greater or larger that original amount?
Answers: 1
You know the right answer?
the graph shows the volume of a gas sample changes as the temperature changes and the pressure remai...
Questions
Mathematics, 08.12.2021 04:50

History, 08.12.2021 04:50


Spanish, 08.12.2021 04:50
Mathematics, 08.12.2021 04:50


History, 08.12.2021 04:50
Social Studies, 08.12.2021 04:50
Mathematics, 08.12.2021 04:50
Mathematics, 08.12.2021 04:50
Mathematics, 08.12.2021 04:50
Mathematics, 08.12.2021 04:50
Mathematics, 08.12.2021 04:50


