
Mathematics, 12.11.2020 04:40 JvGaming2001
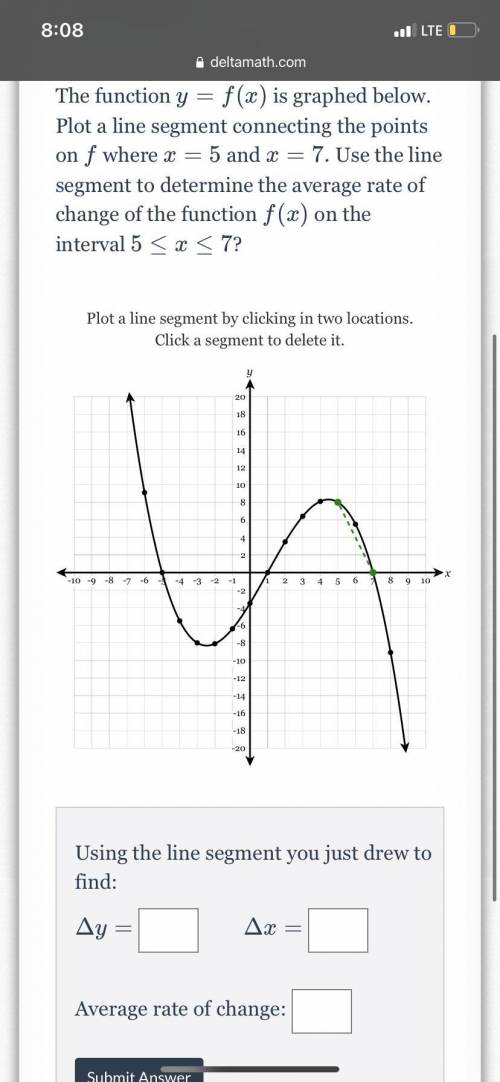
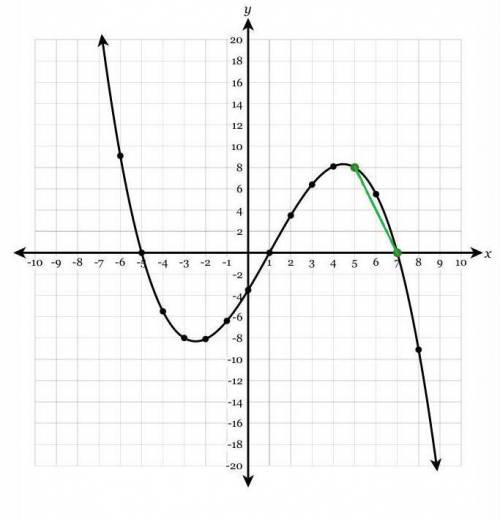
The function y=f(x) is graphed below. Plot a line segment connecting the the points on f where x=5 and x=7. Use the line segment to determine the average rate of change of the function f(x) on the interval

Answers: 3


Another question on Mathematics
Mathematics, 21.06.2019 17:00
Acircular garden with radius of 8 feet is surrounded by a circular path with a width of 3 feet. what is the approximate area of the path alone? use 3.14 for π
Answers: 3
Mathematics, 21.06.2019 17:30
Is it true or false i’m trying to pass this test so i can leave school
Answers: 2
Mathematics, 21.06.2019 19:00
For the following geometric sequence, find the recursive formula. {-80, 20, -5, } i need : ')
Answers: 1
Mathematics, 21.06.2019 20:00
What is the ratio of the length of an object in yards to the length of the same object in miles?
Answers: 3
You know the right answer?
The function y=f(x) is graphed below. Plot a line segment connecting the the points on f where x=5 a...
Questions


Biology, 03.09.2019 00:20

Social Studies, 03.09.2019 00:20
Mathematics, 03.09.2019 00:20

Mathematics, 03.09.2019 00:20


