Which is a linear graph, and which is a nonlinear graph?
How do you know?
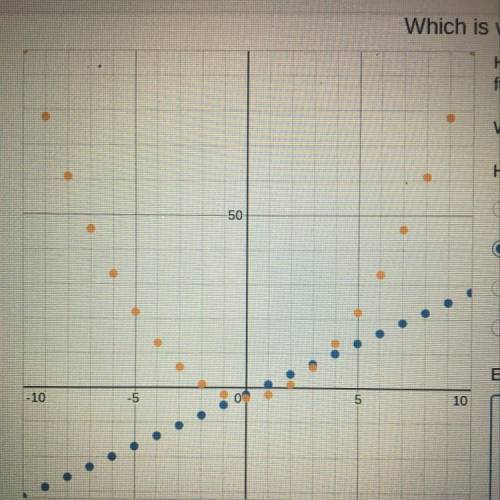
Orange is linear; b...

Mathematics, 13.11.2020 07:10 nayely1020
Which is a linear graph, and which is a nonlinear graph?
How do you know?
Orange is linear; blue is nonlinear
Blue is linear; orange is nonlinear
Both are linear
Both are nonlinear

Answers: 2


Another question on Mathematics
Mathematics, 21.06.2019 17:00
Asays "we are both knaves" and b says nothing. exercises 24–31 relate to inhabitants of an island on which there are three kinds of people: knights who always tell the truth, knaves who always lie, and spies (called normals by smullyan [sm78]) who can either lie or tell the truth. you encounter three people, a, b, and c. you know one of these people is a knight, one is a knave, and one is a spy. each of the three people knows the type of person each of other two is. for each of these situations, if possible, determine whether there is a unique solution and determine who the knave, knight, and spy are. when there is no unique solution, list all possible solutions or state that there are no solutions. 24. a says "c is the knave," b says, "a is the knight," and c says "i am the spy."
Answers: 2
Mathematics, 22.06.2019 01:40
Over the last 4 seconds, a snail has traveled 4/9 of an inch. if the snail traveled the same distance each second, how far did it travel each second?
Answers: 2
Mathematics, 22.06.2019 02:30
From a party ,lori made a fruit punch from 1 gallon of orange juice ,2 quarts of grape juice,5 pints of pineapple juice,and 12 cups of cranbarry juice order the juice from least to greatest amount used in the fruit punch
Answers: 3
Mathematics, 22.06.2019 03:00
The biologist has a second culture to examine. she knows that the population of the culture doubles every 15 minutes. after 1 hour and 15 minutes, her assistant found that 80,000 bacteria were present. a) what was the size of the initial population? b) predict the size of the culture at t=3 hours. what was the size of the population at 40 minutes? explain and justify your answers. c) create a graph of the population as a function of time. find an equation that can be used to predict the size of the population at any time t. d) examine the rate at which the bacteria culture is growing. how fast is the culture growing after 1 hour? after 1.5 hours? after 2 hours? use a time interval of h = 0.01 hours to estimate these rates. interpret these rates in terms of the context of the problem situation. how do these three rates compare?
Answers: 1
You know the right answer?
Questions

Mathematics, 13.04.2020 20:07
Mathematics, 13.04.2020 20:07

Social Studies, 13.04.2020 20:07
History, 13.04.2020 20:07

Social Studies, 13.04.2020 20:07
Mathematics, 13.04.2020 20:07

Spanish, 13.04.2020 20:07

Mathematics, 13.04.2020 20:08

Physics, 13.04.2020 20:08
Social Studies, 13.04.2020 20:08

Biology, 13.04.2020 20:08


