
Mathematics, 21.11.2020 17:20 cindykulei3719
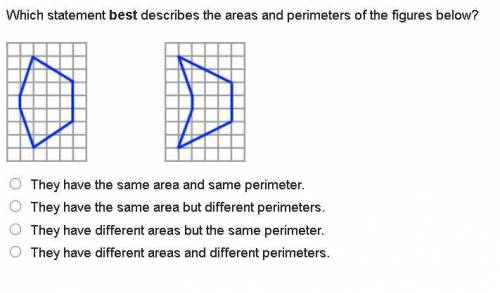
Which statement best describes the areas and perimeters of the figures below?
Figures 1 and 2 both have the same perimeter, but have different numbers of units inside of the shape.
They have the same area and same perimeter.
They have the same area but different perimeters.
They have different areas but the same perimeter.
They have different areas and different perimeters.

Answers: 2


Another question on Mathematics
Mathematics, 21.06.2019 21:50
Which equation shows the quadratic formula used correctly to solve 5x2 + 3x -4 0 for x? cos -3+ v (3) 2-4() 2(5) 3+ |(3)² +4() 205) 3+ (3) 2-4() -3+ v (3)² +4()
Answers: 1
Mathematics, 22.06.2019 01:30
The host of a game show is holding a bag with chips to see what prizes the contestants will play for. five (5) of the chips say “new car” ten (10) of the chips say “new tv” three (3) of the chips say “trip to france” contestant named “patty” reaches into the bag. a. what is the probability of choosing a tv chip? b. what is the probability of choosing a car chip next without replacing the 1st chip? c. are these dependent or independent events?
Answers: 1
Mathematics, 22.06.2019 02:30
Jody bought 20 shares of amazon at the close price of $121.00. she bought 20 more shares a year later at the price of $127.00. two years later, she sold all of her shares at the price of $133.00. her broker charges $50 for each transaction. after all of these transactions, how much money did jody make?
Answers: 2
Mathematics, 22.06.2019 07:00
The table and the graph each show a different relationship between the same two variables, x and y: a table with two columns and 5 rows is shown. the column head for the left column is x, and the column head for the right column is y. the row entries in the table are 3,240 and 4,320 and 5,400 and 6,480. on the right of this table is a graph. the x-axis values are from 0 to 10 in increments of 2 for each grid line. the y-axis values on the graph are from 0 to 350 in increments of 70 for each grid line. a line passing through the ordered pairs 2, 70 and 4, 140 and 6, 210 and 8, 280 is drawn. how much more would the value of y be in the table, than its value on the graph, when x = 11?
Answers: 2
You know the right answer?
Which statement best describes the areas and perimeters of the figures below?
Figures 1 and 2 both...
Questions


Social Studies, 23.05.2020 14:58

Computers and Technology, 23.05.2020 14:58

Biology, 23.05.2020 14:58

Biology, 23.05.2020 14:58
Mathematics, 23.05.2020 14:58

Mathematics, 23.05.2020 14:58
Mathematics, 23.05.2020 14:58


