Mathematics, 04.12.2020 18:00 Wanna14ever
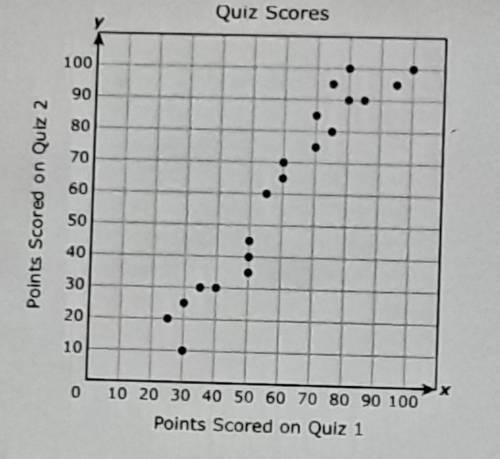
:A teacher collected data on 20 students for two different quizzes. The scatterplot below shows the relationship between the number of points scored on Quiz 1 and the number of points scored on Quiz 2. Points Scored on Quiz 1 Based on the data in the scatterplot, predict the score a student would make on Quiz 2 if she scored 65 points on Quiz 1. 72,82,68,78


Answers: 3


Another question on Mathematics

Mathematics, 21.06.2019 19:30
Your food costs are $5,500. your total food sales are $11,000. what percent of your food sales do the food costs represent?
Answers: 2

Mathematics, 21.06.2019 21:30
The domain of a function can be represented by which one of the following options? o a. a set of output values o b. a set of f(x) values o c. a set of input values o d. a set of both input and output values
Answers: 3

Mathematics, 21.06.2019 22:30
What is the approximate value of q in the equation below? –1.613–1.5220.5853.079
Answers: 1

Mathematics, 22.06.2019 01:10
What is the angle measure, or angle of depression, between this bird and the bird watcher?
Answers: 1
You know the right answer?
:A teacher collected data on 20 students for two different quizzes. The scatterplot below shows the...
Questions


History, 31.07.2021 07:00

English, 31.07.2021 07:00


Mathematics, 31.07.2021 07:00

Computers and Technology, 31.07.2021 07:00


Computers and Technology, 31.07.2021 07:00

English, 31.07.2021 07:00

Spanish, 31.07.2021 07:00

Computers and Technology, 31.07.2021 07:00


Chemistry, 31.07.2021 07:00

Computers and Technology, 31.07.2021 07:00


