Mathematics, 05.12.2020 08:50 jacob7542
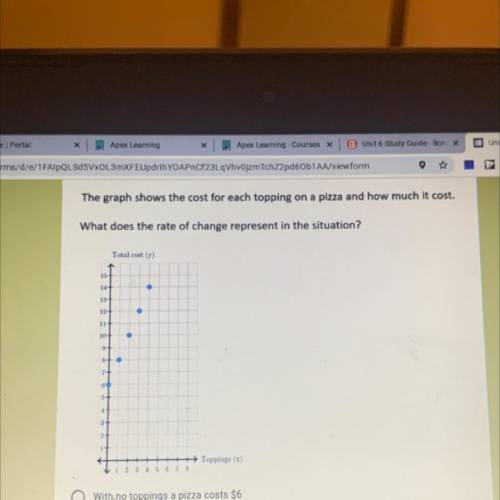
The graph shows the cost for each topping on a pizza and how much it cost.
What does the rate of change represent in the situation?
Total cost (y)
15
14
13
194
11
10+
9
7
6
5
4
3-
2
+Toppings (3)
1 2 3 4 5 6 7 8
With no toppings a pizza costs $6
Each topping costs $1
With no toppinga a pizza costs $14
O
Each topping costs $6


Answers: 3


Another question on Mathematics

Mathematics, 21.06.2019 17:00
Describe what moves you could use to create the transformation of the original image shown at right
Answers: 1

Mathematics, 21.06.2019 19:50
The graph shows the distance kerri drives on a trip. what is kerri's speed . a. 25 b.75 c.60 d.50
Answers: 1

Mathematics, 21.06.2019 20:00
Pepe and leo deposits money into their savings account at the end of the month the table shows the account balances. if there pattern of savings continue and neither earns interest nor withdraw any of the money , how will the balance compare after a very long time ?
Answers: 1

Mathematics, 21.06.2019 20:20
Convert the mixed numbers into improper fractions. convert the improper fraction to mixed numbers.
Answers: 1
You know the right answer?
The graph shows the cost for each topping on a pizza and how much it cost.
What does the rate of ch...
Questions


Social Studies, 04.08.2019 07:00

Social Studies, 04.08.2019 07:00

History, 04.08.2019 07:00

Social Studies, 04.08.2019 07:00

Social Studies, 04.08.2019 07:00

Biology, 04.08.2019 07:00


Biology, 04.08.2019 07:00

Biology, 04.08.2019 07:00

Mathematics, 04.08.2019 07:00

English, 04.08.2019 07:00


History, 04.08.2019 07:00

Biology, 04.08.2019 07:00


