
Mathematics, 07.12.2020 07:30 GreenHerbz206
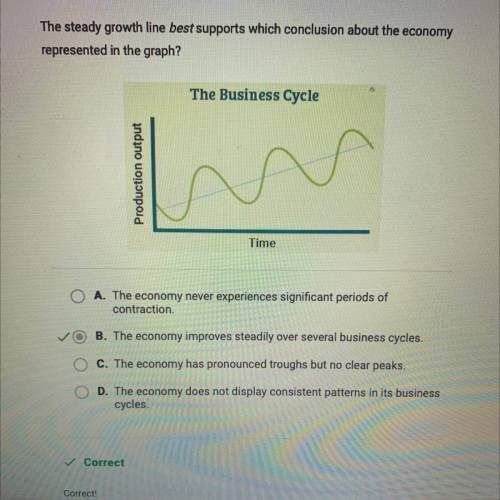
The steady growth line best supports which conclusion about the economy represented in the graph

Answers: 1


Another question on Mathematics
Mathematics, 21.06.2019 13:30
The graph shown below expresses a radical function that can be written in the form f(x)=a(x+k)1/n+c what does the graph tell you about the value of n in this function
Answers: 3
Mathematics, 21.06.2019 17:40
Find the volume of the described solid.the solid lies between planes perpendicular to the x-axis at x = 0 and x=7. the cross sectionsperpendicular to the x-axis between these planes are squares whose bases run from the parabolay=-31x to the parabola y = 30/x.a) 441b) 147c) 864d) 882
Answers: 1
Mathematics, 21.06.2019 20:40
David estimated he had about 20 fish in his pond. a year later, there were about 1.5 times as many fish. the year after that, the number of fish increased by a factor of 1.5 again. the number of fish is modeled by f(x)=20(1.5)^x. create a question you could ask that could be answered only by graphing or using a logarithm.
Answers: 1
You know the right answer?
The steady growth line best supports which conclusion about the economy represented in the graph
Questions
Mathematics, 10.11.2019 10:31

History, 10.11.2019 10:31
History, 10.11.2019 10:31


Mathematics, 10.11.2019 10:31


Social Studies, 10.11.2019 10:31
English, 10.11.2019 10:31
English, 10.11.2019 10:31

Health, 10.11.2019 10:31

Chemistry, 10.11.2019 10:31


