
Mathematics, 08.12.2020 21:00 elsauceomotho
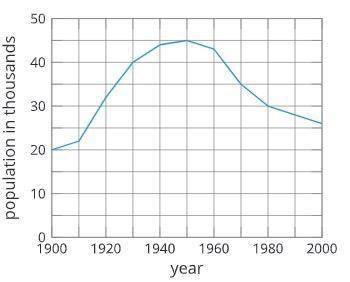
The graph shows the population of a city form 1900 to 2000.
What is the the average rate of change of the population between 1930 and 1950?
Remember the average rate of change formula:
f(b)−f(a)/b-a
Hint: that is the same as slope.
Group of answer choices
A. 200 people per year
B. 250 people per year
C. 300 people per year
D. 400 people per year

Answers: 1


Another question on Mathematics
Mathematics, 21.06.2019 16:00
Awall map has a scale of 128 miles = 6 inches. the distance between springfield and lakeview is 2 feet on the map. what is the actual distance between springfield and lakeview? 384 miles 512 miles 1.13 miles 42.7 miles
Answers: 1
Mathematics, 21.06.2019 19:30
Write an equation for the function that includes the points (2,100)and (3,100)
Answers: 2
Mathematics, 21.06.2019 22:30
Maria found the least common multiple of 6 and 15. her work is shown below. multiples of 6: 6, 12, 18, 24, 30, 36, 42, 48, 54, 60, . . multiples of 15: 15, 30, 45, 60, . . the least common multiple is 60. what is maria's error?
Answers: 1
Mathematics, 21.06.2019 22:30
Agroup of randomly selected members of the foodies food club were asked to pick their favorite type of food. the bar graph below shows the results of the survey. there are 244 members in the foodies.
Answers: 3
You know the right answer?
The graph shows the population of a city form 1900 to 2000.
What is the the average rate of change...
Questions
Mathematics, 01.09.2019 21:00


Social Studies, 01.09.2019 21:00
Social Studies, 01.09.2019 21:00


Computers and Technology, 01.09.2019 21:00
History, 01.09.2019 21:00
Mathematics, 01.09.2019 21:00
English, 01.09.2019 21:00
History, 01.09.2019 21:00


