
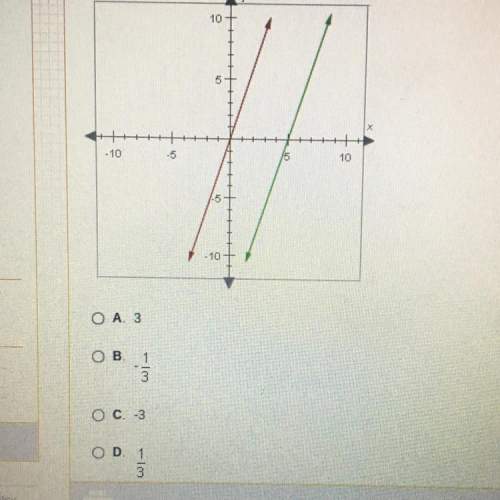
Mathematics, 20.12.2020 18:10 ashhrooks
A graph shows the horizontal axis numbered 1 to 5 and the vertical axis numbered 1 to 5. Points and a line show an upward trend.
Which is most likely the correlation coefficient for the set of data shown?
–0.65
–0.19
0.19
0.75
a weak positive correlation
a strong positive correlation
a weak negative correlation
a strong negative correlation

Answers: 2


Another question on Mathematics
Mathematics, 21.06.2019 16:00
Select the correct answer. joshua likes to read. he read 6 books when he was 6 years old. every year he doubled the number of books he read the previous year. how many total books did he read between the ages of 6 and 10? a. 60 b. 90 c.186 d.187
Answers: 1
Mathematics, 21.06.2019 16:50
The table represents a linear function. what is the slope of the function? –6 –4 4 6
Answers: 3
You know the right answer?
A graph shows the horizontal axis numbered 1 to 5 and the vertical axis numbered 1 to 5. Points and...
Questions

Mathematics, 09.11.2020 05:50
Mathematics, 09.11.2020 05:50

Chemistry, 09.11.2020 05:50


History, 09.11.2020 05:50
Mathematics, 09.11.2020 05:50
Mathematics, 09.11.2020 05:50

Mathematics, 09.11.2020 05:50
Mathematics, 09.11.2020 05:50


