
Mathematics, 31.12.2020 15:20 school4life110
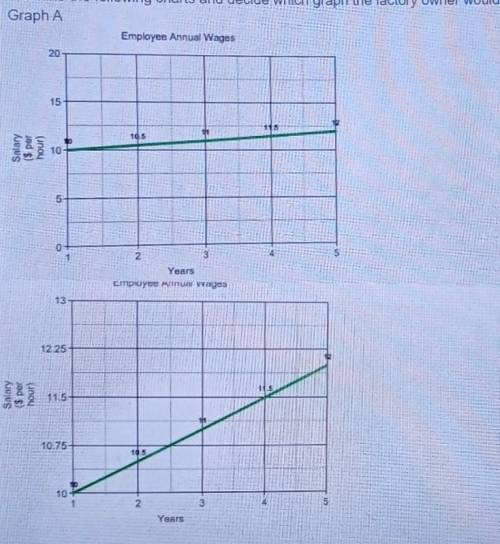
Employee annual wages at a plant rose steadily, but very gradually, from one year to the next during one 5-year period. The factory owner wants to show that worker's wages are rising rapidly. Examine the following charts and decide which graph the factory owner would want to use and why.
Graph A Employee Annual Wages 20 15 10.5 Salary ($ per hour) 10 0 3 Years
Graph B Emplover Annual Wades

Answers: 3


Another question on Mathematics
Mathematics, 21.06.2019 18:00
Solve this equation using substitution. {4x + y = −2} {4x + 6y = 44}
Answers: 1
Mathematics, 21.06.2019 20:00
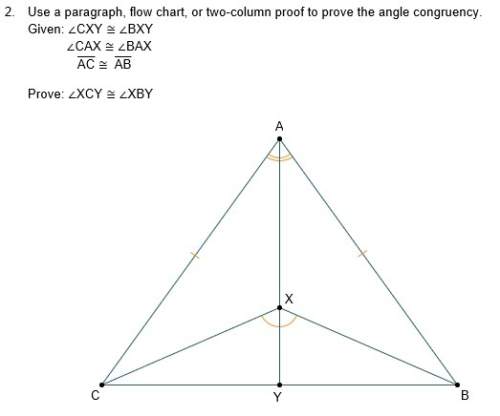
Which part of a 2-column proof is the hypothesis of the conjecture? a) given b) reasons c) prove d) statements ! i think it's b but i'm not quite
Answers: 3
Mathematics, 21.06.2019 20:00
Someone answer asap for ! the boiling point of water at an elevation of 0 feet is 212 degrees fahrenheit (°f). for every 1,000 feet of increase in elevation, the boiling point of water decreases by about 2°f. which of the following represents this relationship if b is the boiling point of water at an elevation of e thousand feet? a. e = 2b - 212 b. b = 2e - 212 c. e = -2b + 212 d. b = -2e + 212
Answers: 1
You know the right answer?
Employee annual wages at a plant rose steadily, but very gradually, from one year to the next during...
Questions

Health, 28.10.2020 03:00


Biology, 28.10.2020 03:00
Biology, 28.10.2020 03:00

Arts, 28.10.2020 03:00

Advanced Placement (AP), 28.10.2020 03:00
Mathematics, 28.10.2020 03:00


Social Studies, 28.10.2020 03:00
Mathematics, 28.10.2020 03:00


