
Mathematics, 01.01.2021 21:10 queentynaisa
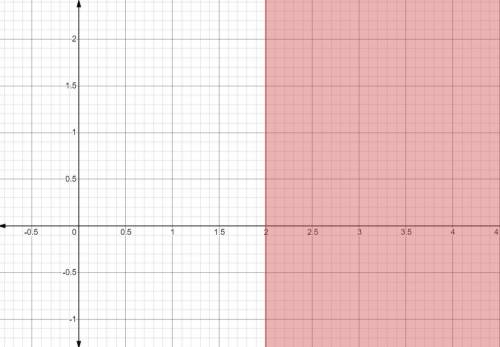
Graph x≥2.
A graph showing a range of negative three to two on the x and y axes. A dotted line with arrows at both ends passes through the x axis at two and runs parallel to the y axis. The graph is shaded to the right of the line.
A graph showing a range of negative three to two on the x and y axes. A solid line with arrows at both ends passes through the x axis at two and runs parallel to the y axis. The graph is shaded to the left of the line.
A graph showing a range of negative three to two on the x and y axes. A solid line with arrows at both ends passes through the x axis at two and runs parallel to the y axis. The graph is shaded to the right of the line.
A graph showing a range of negative three to two on the x and y axes. A dotted line with arrows at both ends that passes through the x axis at two and runs parallel to the y axis. The graph is shaded to the left of the line.

Answers: 1


Another question on Mathematics
Mathematics, 21.06.2019 15:00
Which property is illustrated by the following statement? if hxa rgi, then rgi hxa.
Answers: 1
Mathematics, 21.06.2019 17:00
Jasmine wants to eat at 8: 00pm her meal takes 65mins to cook what time does she need to put the meal in the oven
Answers: 2
Mathematics, 21.06.2019 18:00
Janie has $3. she earns $1.20 for each chore she does and can do fractions of chores. she wants to earn enough money to buy a cd for $13.50. write an inequality to determine the number of chores, c, janie could do to have enough money to buy the cd.
Answers: 1
Mathematics, 21.06.2019 23:00
Someone answer this asap for the function f(x) and g(x) are both quadratic functions. f(x) = x² + 2x + 5 g(x) = x² + 2x - 1 which statement best describes the graph of g(x) compared to the graph of f(x)? a. the graph of g(x) is the graph of f(x) shifted down 1 units. b. the graph of g(x) is the graph of f(x) shifted down 6 units. c. the graph of g(x) is the graph of f(x) shifted to the right 1 unit. d. the graph of g(x) is the graph of f(x) shifted tothe right 6 units.
Answers: 3
You know the right answer?
Graph x≥2.
A graph showing a range of negative three to two on the x and y axes. A dotted line with...
Questions

History, 21.08.2019 20:00
Mathematics, 21.08.2019 20:00

Computers and Technology, 21.08.2019 20:00

Biology, 21.08.2019 20:00

English, 21.08.2019 20:00
English, 21.08.2019 20:00
English, 21.08.2019 20:00
Biology, 21.08.2019 20:00
Mathematics, 21.08.2019 20:00
Mathematics, 21.08.2019 20:00


