
Mathematics, 07.01.2021 22:50 Chapman645
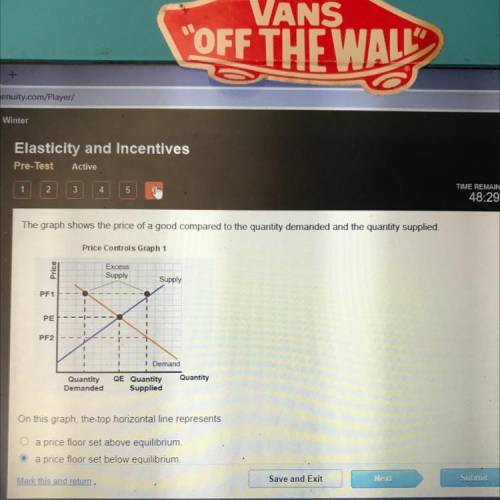
The graph shows the price of a good compared to the quantity demanded and the quantity supplied
Price Controls Graph 1
Supply
Supply
PF1
PE
PF2
Quantity
Demanded
I Demand
QE Quantity
Quantity
Supplied
On this graph, the top horizontal line represents
O a price floor set above equilibrium
a price floor set below equilibrium

Answers: 2


Another question on Mathematics
Mathematics, 21.06.2019 17:30
Nine more than four times a number is the same as one less than twice the number. find the number?
Answers: 1
Mathematics, 21.06.2019 23:30
What is the volume of a rectangular crate that has dimensions 9 inches by 9 inches by 1 feet? 1,458 in.3 121.5 in.3 1,012.5 in.3 36 in.3
Answers: 1
You know the right answer?
The graph shows the price of a good compared to the quantity demanded and the quantity supplied
Pri...
Questions
Mathematics, 15.12.2020 01:00


Chemistry, 15.12.2020 01:00
Mathematics, 15.12.2020 01:00
Mathematics, 15.12.2020 01:00

Geography, 15.12.2020 01:00
Mathematics, 15.12.2020 01:00

Mathematics, 15.12.2020 01:00


