
Mathematics, 09.01.2021 01:00 znewkirk4741
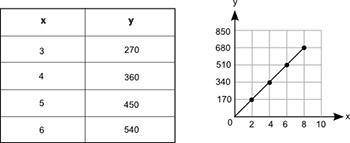
The table and the graph each show a different relationship between the same two variables, x and y:
How much more would the value of y be in the table, than its value on the graph, when x = 11?
A) 55
B) 95
C) 100
D) 215

Answers: 1


Another question on Mathematics
Mathematics, 21.06.2019 16:40
Which of the following is most likely the next step in the series? a3z, b6y, c9x, d12w, е15v, f18u
Answers: 2
Mathematics, 21.06.2019 18:00
Someone answer this asap rn for ! a discount store’s prices are 25% lower than department store prices. the function c(x) = 0.75x can be used to determine the cost c, in dollars, of an item, where x is the department store price, in dollars. if the item has not sold in one month, the discount store takes an additional 20% off the discounted price and an additional $5 off the total purchase. the function d(y) = 0.80y - 5 can be used to find d, the cost, in dollars, of an item that has not been sold for a month, where y is the discount store price, in dollars. create a function d(c(x)) that represents the final price of an item when a costumer buys an item that has been in the discount store for a month. d(c(x)) =
Answers: 2
Mathematics, 22.06.2019 01:30
What is the t intercept of the line given by the equation below y= -10x + 14
Answers: 3
You know the right answer?
The table and the graph each show a different relationship between the same two variables, x and y:...
Questions

Mathematics, 17.10.2020 22:01
Mathematics, 17.10.2020 22:01

Physics, 17.10.2020 22:01


History, 17.10.2020 22:01
Mathematics, 17.10.2020 22:01
SAT, 17.10.2020 22:01

Mathematics, 17.10.2020 22:01
Social Studies, 17.10.2020 22:01


Mathematics, 17.10.2020 22:01
English, 17.10.2020 22:01


