
Mathematics, 24.08.2019 01:50 makayla2583
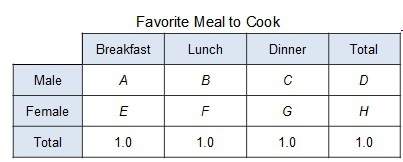
The conditional relative frequency table below was generated by column using data comparing gender and a person's favorite meal to cook.
which would most likely indicate an association between the categorical variables?
a: the value of a is similar to the value of b.
b: the value of a is similar to the value of e.
c: the value of b is not similar to the value of c.
d: the value of b is not similar to the value of f.

Answers: 2


Another question on Mathematics
Mathematics, 21.06.2019 19:40
Graph y = -|x| + 2. click on the graph until the correct one appears.
Answers: 3
Mathematics, 21.06.2019 21:30
Mon wants to make 5 lbs of the sugar syrup. how much water and how much sugar does he need… …to make 5% syrup?
Answers: 2
Mathematics, 21.06.2019 23:20
What is the slope of the line that contains the points (-5, 6) and (14. - 7)?
Answers: 1
You know the right answer?
The conditional relative frequency table below was generated by column using data comparing gender a...
Questions


Business, 05.02.2020 09:02

History, 05.02.2020 09:02
Physics, 05.02.2020 09:02

Mathematics, 05.02.2020 09:02

Chemistry, 05.02.2020 09:02
Mathematics, 05.02.2020 09:02


