
Mathematics, 12.01.2021 22:20 sierram298
(Please show your work..)
The data set shows the January 1 noon temperatures in degrees Fahrenheit for a particular city in each of the past 6 years.
28 34 27 42 52 15
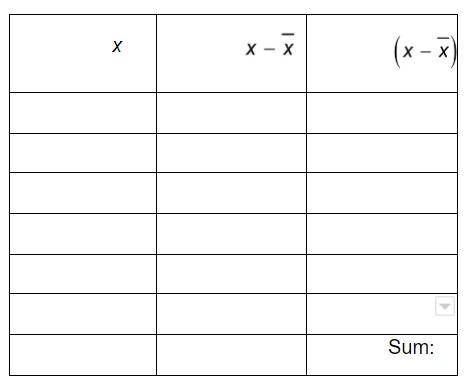
C; What is the sum of the squares of the differences between each data value and the mean? Use the table to organize your work.
D; What is the standard deviation of the data set? Use the sum from Part (c) and show your work

Answers: 2


Another question on Mathematics
Mathematics, 21.06.2019 17:40
The graph of h(x)= |x-10| +6 is shown. on which interval is this graph increasing
Answers: 2
Mathematics, 21.06.2019 18:30
This is my question~~ ( r ^ 4 - 2r ^ 3 - 23 r ^ 2 - 4r - 32)÷(r+4) ~~ i must use long division to solve it : / i was wondering if anyone world like to solve it. and if so, share step-by-step explanations! you! ❤
Answers: 2
Mathematics, 21.06.2019 20:30
In the diagram of circle o, what is the measure of zabc?
Answers: 2
Mathematics, 21.06.2019 22:30
Factor the polynomial by its greatest common monomial factor.
Answers: 1
You know the right answer?
(Please show your work..)
The data set shows the January 1 noon temperatures in degrees Fahrenheit...
Questions

History, 17.07.2019 10:00

Biology, 17.07.2019 10:00
History, 17.07.2019 10:00

Physics, 17.07.2019 10:00

History, 17.07.2019 10:00

Geography, 17.07.2019 10:00
Mathematics, 17.07.2019 10:00


Mathematics, 17.07.2019 10:00


