
Mathematics, 28.01.2021 01:10 samoanlgnd
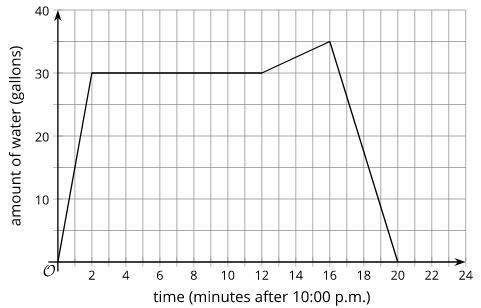
The graph shows the amount of water in a bathtub starting at 10:00 pm. Select all true statements.
A) The tub was filling faster at 10:14 pm than at 10:01 pm.
B) At 10:06 pm, the tub was neither filling nor draining.
C) The maximum amount of water in the tub was about 35 gallons.
D) The amount of water in the tub stayed the same from 10:16 pm to 10:20 pm.
E) It took 4 minutes for the tub to drain.

Answers: 2


Another question on Mathematics
Mathematics, 21.06.2019 22:00
Aprofessional hockey team has noticed that, over the past several seasons, as the number of wins increases, the total number of hot dogs sold at the concession stands increases. the hockey team concludes that winning makes people crave hot dogs. what is wrong with the hockey team's conclusion? a) it does not take into account the attendance during each season. b) it does not take into account the number of hamburgers sold during each season. c) it does not take into account the number of concession stands in the hockey arena. d) it does not take into account the number of seasons the hockey team has been in existence.
Answers: 1
Mathematics, 21.06.2019 22:30
What is the point slope form of a line with slope -5 that contains point (2,-1)
Answers: 1
Mathematics, 22.06.2019 02:00
Pleasseee important quick note: enter your answer and show all the steps that you use to solve this problem in the space provided. use the circle graph shown below to answer the question. a pie chart labeled favorite sports to watch is divided into three portions. football represents 42 percent, baseball represents 33 percent, and soccer represents 25 percent. if 210 people said football was their favorite sport to watch, how many people were surveyed?
Answers: 1
Mathematics, 22.06.2019 02:30
According to a research study, parents with young children slept 6.4 hours each night last year, on average. a random sample of 18 parents with young children was surveyed and the mean amount of time per night each parent slept was 6.8. this data has a sample standard deviation of 0.9. (assume that the scores are normally distributed.) researchers conduct a one-mean hypothesis at the 5% significance level, to test if the mean amount of time parents with young children sleep per night is greater than the mean amount of time last year. the null and alternative hypotheses are h0: μ=6.4 and ha: μ> 6.4, which is a right-tailed test. the test statistic is determined to be t0=1.89 using the partial t-table below, determine the critical value(s). if there is only one critical value, leave the second answer box blank.
Answers: 3
You know the right answer?
The graph shows the amount of water in a bathtub starting at 10:00 pm. Select all true statements....
Questions

English, 14.07.2020 22:01

Physics, 14.07.2020 22:01


Business, 14.07.2020 22:01


