Which word best describes the degree of overlap between the two data sets?
moderate
hig...

Mathematics, 10.02.2021 01:20 brendamillan05
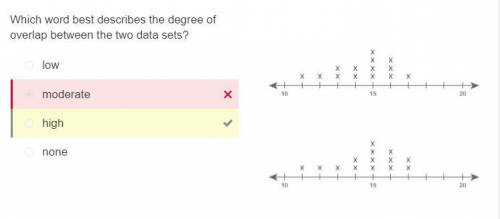
Which word best describes the degree of overlap between the two data sets?
moderate
high
none
low
Two line plots with the same scale and interval, from ten to twenty, with tick marks every one unit. The plots are stacked vertically for comparison. Each plot has fourteen data values. Values appear as x marks above the line. Upper plot data values are one x mark above eleven, one x mark above twelve, two x marks above thirteen, two x marks above fourteen, four x marks above fifteen, three x marks above sixteen, and one x mark above seventeen. Lower plot data values are one x mark above 11, one x mark above twelve, one x mark above thirteen, two x marks above fourteen, four x marks above fifteen, three x marks above sixteen, and two x marks above seventeen.

Answers: 3


Another question on Mathematics
Mathematics, 21.06.2019 17:40
Given f(x)= 9x+1 and g(x)=x^3, choose the expression (f*g)(x)
Answers: 2
Mathematics, 21.06.2019 17:40
If sec theta = 5/3 and the terminal point determined by theta is in quadrant 4, then
Answers: 1
Mathematics, 21.06.2019 23:30
Choose the correct translation for the following statement. it is at most ten. x< 10 x< 10 x> 10 x> 10
Answers: 1
Mathematics, 22.06.2019 04:00
Summary statistics given for independent simple random samples from two populations. use the pooled t-interval procedure to obtain specified confidence interval. x1=71.6, s1=3.9, n1=11, x2=67.9, s2=3.4, n2=9 determine a 99% confidence level.
Answers: 2
You know the right answer?
Questions


Business, 23.03.2020 23:58


History, 23.03.2020 23:58
Mathematics, 23.03.2020 23:58
Mathematics, 23.03.2020 23:58


