
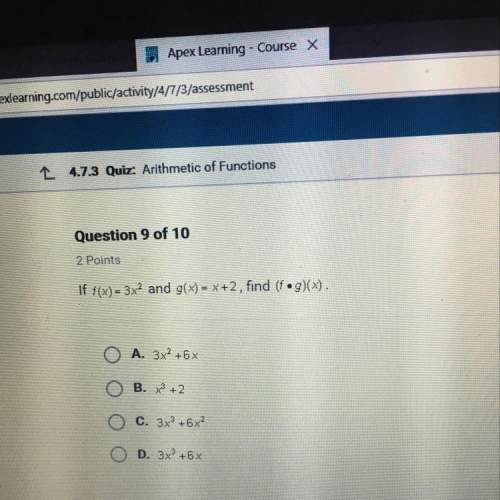
Mathematics, 16.02.2021 06:00 isabel2417
Move the red distribution at the top so that it aligns with the blue distribution. Now look at the green distribution at the bottom. How would you best interpret the green (bottom) distribution?
A- The distribution of differences between the sample means of each group has a mean at or near zero making it likely the two groups are not statistically different.
B- The distribution of differences between the sample means of each group has a mean at or near 325 making it likely the two groups are not statistically different.
C- The distribution of differences between the sample means of each group has a mean at or near zero making it likely the two groups are statistically different.
D- The distribution of differences between the sample means of each group has a mean at or near 325 making it likely the two groups are statistically different.

Answers: 3


Another question on Mathematics
Mathematics, 21.06.2019 16:30
What is the difference between regular convex and concave polygons
Answers: 1
Mathematics, 21.06.2019 18:30
The median of a data set is the measure of center that is found by adding the data values and dividing the total by the number of data values that is the value that occurs with the greatest frequency that is the value midway between the maximum and minimum values in the original data set that is the middle value when the original data values are arranged in order of increasing (or decreasing) magnitude
Answers: 3
Mathematics, 21.06.2019 23:00
Using only odd number for numerators write two different subtraction problems that have a difference of 3/4
Answers: 1
You know the right answer?
Move the red distribution at the top so that it aligns with the blue distribution. Now look at the g...
Questions
Mathematics, 17.02.2020 21:32

History, 17.02.2020 21:32
Mathematics, 17.02.2020 21:32


Computers and Technology, 17.02.2020 21:32

Social Studies, 17.02.2020 21:32


History, 17.02.2020 21:32


