
Mathematics, 17.02.2021 03:40 jadenpmoore2008
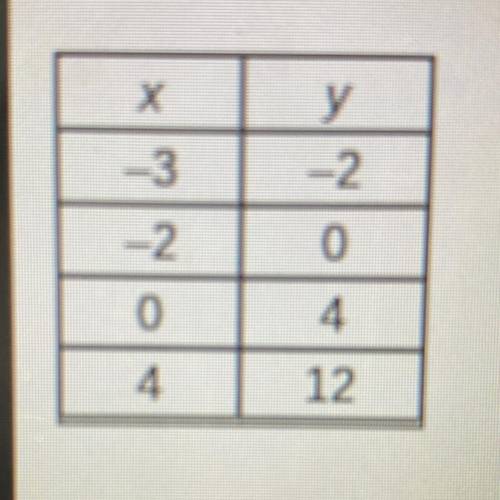
Which best describes the function represented by the data in the table?
-linear with a common ratio of 2
-linear with a common first difference of 2
-quadratic with a common ratio of 2
-quadratic with a common first difference of 2

Answers: 2


Another question on Mathematics
Mathematics, 21.06.2019 19:30
The american academy of pediatrics wants to conduct a survey of recently graduated family practitioners to assess why they did not choose pediatrics for their specialization. provide a definition of the population, suggest a sampling frame, and indicate the appropriate sampling unit.
Answers: 3
Mathematics, 21.06.2019 21:30
Design an er diagram for keeping track of information about votes taken in the u.s. house of representatives during the current two-year congressional session. the database needs to keep track of each u.s. state's name (e.g., texas', new york', california') and include the region of the state (whose domain is {northeast', midwest', southeast', southwest', west'}). each congress person in the house of representatives is described by his or her name, plus the district represented, the start date when the congressperson was first elected, and the political party to which he or she belongs (whose domain is {republican', democrat', 'independent', other'}). the database keeps track of each bill (i.e., proposed law), including the bill name, the date of vote on the bill, whether the bill passed or failed (whose domain is {yes', no'}), and the sponsor (the congressperson(s) who sponsored - that is, proposed - the bill). the database also keeps track of how each congressperson voted on each bill (domain of vote attribute is {yes', no', abstain', absent'}). additional information:
Answers: 1
Mathematics, 21.06.2019 22:00
The birth weights of newborn babies in the unites states follow in a normal distrubution with a mean of 3.4 kg and standard deviation of 0.6 kg. reaserches interested in studying how. children gain weights decide to take random samples of 100 newborn babies and calculate the sample mean birth weights for each sample
Answers: 1
Mathematics, 22.06.2019 01:30
Adriana had a garden where he measured the height of a corn plant. what. on the first day,it was 145 cm tall.after 2 weeks is grew by 23 cm.what is the height of the corn plant
Answers: 1
You know the right answer?
Which best describes the function represented by the data in the table?
-linear with a common ratio...
Questions


Social Studies, 08.12.2021 21:50


English, 08.12.2021 21:50

Mathematics, 08.12.2021 21:50
Mathematics, 08.12.2021 21:50

Social Studies, 08.12.2021 21:50


