
Mathematics, 17.02.2021 21:30 jogose6
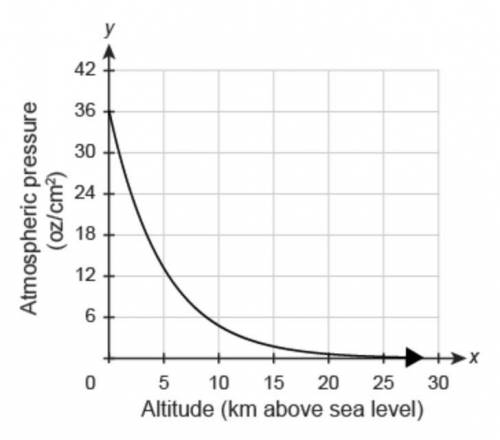
The graph represents the atmospheric pressure, in ounces per square centimeter, as a function of altitude in kilometers above sea level.
Which statements accurately reflect this relationship?
Select EACH correct answer. [Not just one].
a) The atmospheric pressure gets close to 36oz/cm2 as the altitude continues to increase.
b) As the altitude continues to increase, the atmospheric pressure approaches 0oz/cm2
c) As the altitude decreases, the atmospheric pressure increases.
d) The atmospheric pressure is 0oz/cm2 at sea level.

Answers: 2


Another question on Mathematics
Mathematics, 21.06.2019 14:20
Factor p 2 + 18p + 32. (p+ 4)(p + 8) (p + 2)p+ 16) (p + 16)2
Answers: 1
Mathematics, 21.06.2019 23:00
What is the location of point g, which partitions the directed line segment from d to f into a 5: 4 ratio? –1 0 2 3
Answers: 1
Mathematics, 21.06.2019 23:00
Look at the chart showing the results of a baseball player at bat. which is the probability of getting a hit?
Answers: 1
Mathematics, 22.06.2019 02:00
The resumâ´es of two male applicants for a college teaching position in chemistry are placed in the same file as the resumâ´es of two female applicants. two positions become available, and the first, at the rank of assistant professor, is filled by selecting one of the four applicants at random. the second position, at the rank of instructor, is then filled by selecting at random one of the remaining three applicants. using the notation m2f1, for example, to denote the simple event that the first position is filled by the second male applicant and the second position is then filled by the first female applicant, (a) list the elements of a sample space s; (b) list the elements of s corresponding to event a that the position of assistant professor is filled by a male applicant; (c) list the elements of s corresponding to event b that exactly one of the two positions is filled by a male applicant; (d) list the elements of s corresponding to event c that neither position is filled by a male applicant; (e) list the elements of s corresponding to the event a â© b; (f) list the elements of s corresponding to the event a âş c; (g) construct a venn diagram to illustrate the intersections and unions of the events a, b, and c.
Answers: 3
You know the right answer?
The graph represents the atmospheric pressure, in ounces per square centimeter, as a function of alt...
Questions

English, 24.08.2021 23:10

Mathematics, 24.08.2021 23:10
Mathematics, 24.08.2021 23:10

Chemistry, 24.08.2021 23:10
Mathematics, 24.08.2021 23:10


Computers and Technology, 24.08.2021 23:10

History, 24.08.2021 23:10
Mathematics, 24.08.2021 23:10


