
Mathematics, 18.02.2021 23:00 keilahsalmon
(20 POINTS)
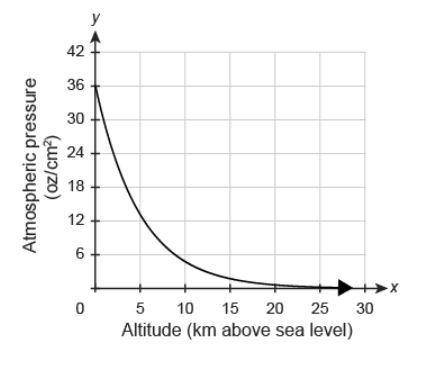
The graph represents the atmospheric pressure, in ounces per square centimeter, as a function of altitude in kilometers above sea level.
Which statements accurately reflect this relationship?
As the altitude decreases, the atmospheric pressure increases
As the altitude continues to increase, the atmospheric pressure approaches 0 oz/cm^2 .
The atmospheric pressure is 0 oz/cm^2 at sea level
The atmospheric pressure gets close to 36 oz/cm^2 as the altitude continues to increase

Answers: 2


Another question on Mathematics
Mathematics, 22.06.2019 03:30
The elmina wilson company produces spaghetti sauce that is used in restaurants. the fixed costs total $1,329,050. the selling price per 64 oz. can of sauce is $12.40. the variable cost per can is $4.80. what is the break-even point in number of cans?
Answers: 1
Mathematics, 22.06.2019 04:00
Yesi's dog weighed 5 pounds when she got him. he now yesi's dog weighed 5 pounds when she got him. he now weighs 45 pounds. how much did yesi's dog gain, in ounces?
Answers: 1
Mathematics, 22.06.2019 04:30
Ahyperbola centered at the origin has a vertex at (-6,0) and a focus at (10,0). what are the directrices?
Answers: 3
You know the right answer?
(20 POINTS)
The graph represents the atmospheric pressure, in ounces per square centimeter, as a fu...
Questions


Chemistry, 28.01.2020 12:31

English, 28.01.2020 12:31
English, 28.01.2020 12:31

History, 28.01.2020 12:31
Mathematics, 28.01.2020 12:31
History, 28.01.2020 12:31


