
Mathematics, 02.03.2021 22:10 emm3456
Plz help will give wut i got (as in points)
Temperature in the desert can be modeled by the function C(t), where t represents hours after midnight (0 ≤ t ≤ 24), and C is the temperature measured in degrees Celsius. Examine what happens to the graph when you transform the function to degrees Fahrenheit.
Circle the desert you picked:
Sahara Desert Patagonian Desert Death Valley California
Exploring Degrees Celsius
1. Fill out the following chart to find the temperatures for t = 12 (noon) and t = 24 (midnight). (2 points: 1 point for each row)
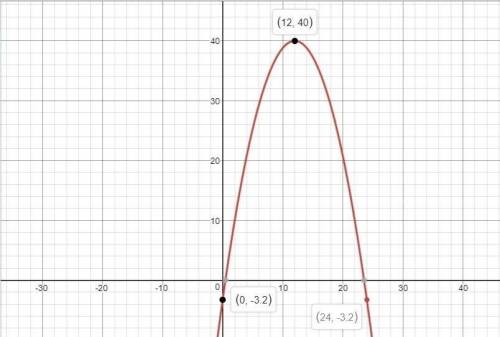
t C(t) = –0.30(t – 12)2 + 40
0
12
24
2. Plot the three points from the chart onto the graph below. Use the plotted points to sketch the graph of C(t) = –0.30(t – 12)2 + 40. (3 points: 2 points for correct coordinates, 1 point for correct shape)
Convert the Function to Degrees Fahrenheit:
3. Suppose you want to represent the desert temperature in degrees Fahrenheit instead. How would you transform the function C(t) to make the new function, F(t)? (2 points: 1 point for each transformation)
Note: The conversion rule for Celsius to Fahrenheit is .
4. Take your values from the previous chart (in question 2) and convert them from Celsius to Fahrenheit. Follow the example below, and use the conversion rule to fill out the chart for degrees Fahrenheit when t = 12 and t = 24. (2 points: 1 point for each row)
t
0
12
24
5. Use the conversion formula to write the equation for the new function, F(t).
(4 points: 2 points for setting up the equation, 2 points for the answer)
Hint: Substitute the equation for C(t) into .
6. Plot the points from the Fahrenheit chart in question 4 onto the graph below. Use the plotted points to sketch out the graph of F(t). (3 points: 2 points for correct coordinates, 1 point for correct shape)
7. Compare the graph in question 6 (F(t)) with the graph in question 2 (C(t)). What changes were made to the graph of C(t) to transform it to F(t)? (1 point)

Answers: 2


Another question on Mathematics
Mathematics, 21.06.2019 16:20
The lengths of nails produced in a factory are normally distributed with a mean of 4.91 centimeters and a standard deviation of 0.05 centimeters. find the two lengths that separate the top 4% and the bottom 4%. these lengths could serve as limits used to identify which nails should be rejected. round your answer to the nearest hundredth, if necessary.
Answers: 3
Mathematics, 21.06.2019 21:10
For each sentence below, find the value of x that makes each sentence true. (515) 5 = 25* x= (813)2 = 4* x=
Answers: 2
Mathematics, 22.06.2019 01:30
Pllz me also i will report if you are in for the 1. complete the table by converting each decimal to a fraction. repeating decimals. 0.31 0.125 0.1607 2. describe any patterns you noticed when converting the decimals in the table above.
Answers: 1
You know the right answer?
Plz help will give wut i got (as in points)
Temperature in the desert can be modeled by the functio...
Questions
Mathematics, 08.07.2019 17:00
Mathematics, 08.07.2019 17:00
Mathematics, 08.07.2019 17:00

English, 08.07.2019 17:00


Social Studies, 08.07.2019 17:00

History, 08.07.2019 17:00
Mathematics, 08.07.2019 17:00
English, 08.07.2019 17:00
English, 08.07.2019 17:00
Mathematics, 08.07.2019 17:00
Mathematics, 08.07.2019 17:00
English, 08.07.2019 17:00
Mathematics, 08.07.2019 17:00
History, 08.07.2019 17:00
Mathematics, 08.07.2019 17:00
History, 08.07.2019 17:00


