
Mathematics, 03.03.2021 21:50 sillslola816oxb5h7
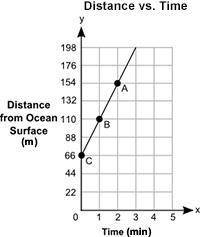
The graph shows the depth, y, in meters, of a shark from the surface of an ocean for a certain amount of time, x, in minutes:
A graph is titled Distance Vs. Time is shown. The x axis is labeled Time in minutes and shows numbers 0, 1, 2, 3, 4, 5. The y axis is labeled Distance from Ocean Surface in meters. A straight line joins the points C at ordered pair 0,66, B at ordered pair 1, 110, A at ordered pair 2, 154, and the ordered pair 3, 198.
Part A: Describe how you can use similar triangles to explain why the slope of the graph between points A and B is the same as the slope of the graph between points A and C. (4 points)
Part B: What are the initial value and slope of the graph, and what do they represent? (6 points)

Answers: 2


Another question on Mathematics
Mathematics, 21.06.2019 17:10
The frequency table shows a set of data collected by a doctor for adult patients who were diagnosed with a strain of influenza. patients with influenza age range number of sick patients 25 to 29 30 to 34 35 to 39 40 to 45 which dot plot could represent the same data as the frequency table? patients with flu
Answers: 2
Mathematics, 22.06.2019 00:00
David leaves his house to go to school. he walks 200 meters west and 300 meters north. how far is david from his original starting point?
Answers: 1
Mathematics, 22.06.2019 00:30
Roy has 4 1/2 pizzas for the soccer team to split after the game. if each member is going to get 1/2 of a pizza, how many players are on the soccer team
Answers: 1
You know the right answer?
The graph shows the depth, y, in meters, of a shark from the surface of an ocean for a certain amoun...
Questions


Mathematics, 25.02.2020 18:58


