The table and graph show how
much money a store earns selling
each team T-shirt and each tea...

Mathematics, 10.03.2021 09:00 china236
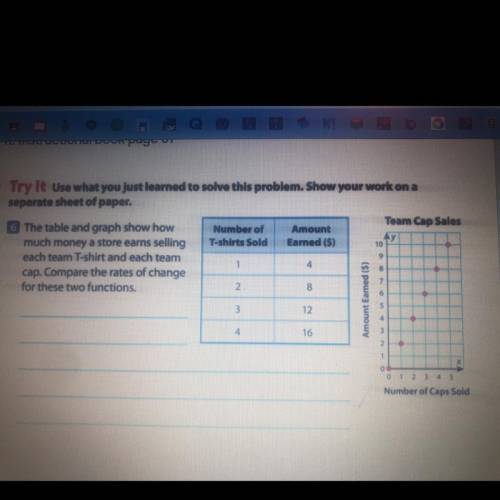
The table and graph show how
much money a store earns selling
each team T-shirt and each team
Cap. Compare the rates of change
for these two functions.

Answers: 1


Another question on Mathematics
Mathematics, 21.06.2019 18:30
Create a data set with 8 points in it that has a mean of approximately 10 and a standard deviation of approximately 1.
Answers: 1
Mathematics, 21.06.2019 19:30
Me max recorded the heights of 500 male humans. he found that the heights were normally distributed around a mean of 177 centimeters. which statements about max’s data must be true? a) the median of max’s data is 250 b) more than half of the data points max recorded were 177 centimeters. c) a data point chosen at random is as likely to be above the mean as it is to be below the mean. d) every height within three standard deviations of the mean is equally likely to be chosen if a data point is selected at random.
Answers: 2
Mathematics, 21.06.2019 20:30
Ateam has p points. p = 3w + d w = wins d = draws a) a football team has 5 wins and 3 draws. how many points does the team have?
Answers: 1
You know the right answer?
Questions

Mathematics, 04.10.2019 19:00

Physics, 04.10.2019 19:00
History, 04.10.2019 19:00

Geography, 04.10.2019 19:00
Mathematics, 04.10.2019 19:00
History, 04.10.2019 19:00

Chemistry, 04.10.2019 19:00

Mathematics, 04.10.2019 19:00
Physics, 04.10.2019 19:00
Mathematics, 04.10.2019 19:00

Biology, 04.10.2019 19:00
Mathematics, 04.10.2019 19:00
Mathematics, 04.10.2019 19:00
History, 04.10.2019 19:00
Mathematics, 04.10.2019 19:00


