
Mathematics, 18.03.2021 03:00 tdluong157
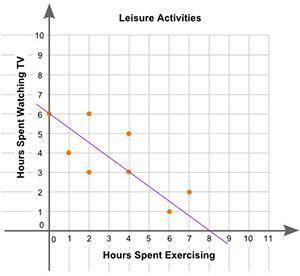
The scatter plot shows the relationship between the weekly hours of watching television and the weekly hours spent exercising, by the students of a high school:
A scatter plot is shown with the title Leisure Activities. The x-axis is labeled hours spent exercising, and the y-axis is labeled hours spent watching TV. Data points are located at 1 and 4, 2 and 6, 2 and 3, 4 and 3, 6 and 1, 4 and 5, 7 and 2, 0 and 6. A line connects the points 0 comma 6 and 8 comma 0.
What is the y-intercept of the line of best fit and what does it represent? (4 points)
a. 6 hours; the number of hours students exercise when they do not watch television
Selected:b. 6 hours; the number of hours students watch television when they do not exerciseThis answer is correct.
c. 8 hours; the number of hours students exercise when they do not watch television
d. 8 hours; the number of hours students watch television when they do not exercise

Answers: 1


Another question on Mathematics
Mathematics, 21.06.2019 14:00
Find an equation of the line perpendicular to the graph.
Answers: 3
Mathematics, 22.06.2019 01:50
Twelve different video games showing substance use were observed and the duration times of game play (in seconds) are listed below. the design of the study justifies the assumption that the sample can be treated as a simple random sample. use the data to construct a 99% confidence interval estimate of μ, the mean duration of game play. 4028 4316 4816 4650 4036 5010 4833 4331 4307
Answers: 1
Mathematics, 22.06.2019 03:30
I6.8.4 test lucas took out a car loan for $14,475 that has a 0% apr for the first 16 months and will be paid off with monthly payments over 5 years. for how many months will lucas be charged interest?
Answers: 3
Mathematics, 22.06.2019 04:00
Which function has an inverse that is also a function? a. g(x) = 2x-3 b. k(x) = -9x2 c. f(x) |x+2| d. w(x) = -20
Answers: 1
You know the right answer?
The scatter plot shows the relationship between the weekly hours of watching television and the week...
Questions


Business, 31.07.2019 07:00
History, 31.07.2019 07:00
History, 31.07.2019 07:00

History, 31.07.2019 07:00
Mathematics, 31.07.2019 07:00
History, 31.07.2019 07:00

Biology, 31.07.2019 07:00

Social Studies, 31.07.2019 07:00
Mathematics, 31.07.2019 07:00

Arts, 31.07.2019 07:00


