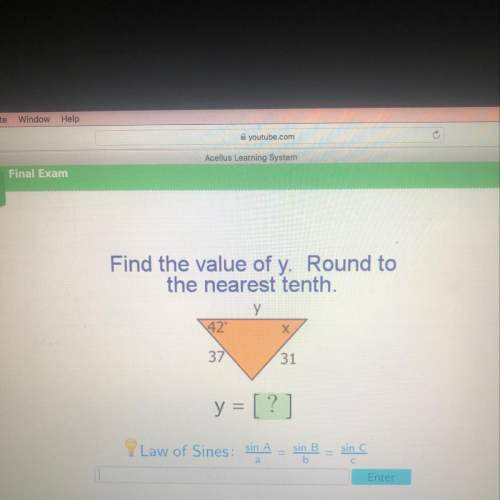
Mathematics, 26.03.2021 21:20 Randomkid0973
A simple random sample of 25 filtered 100 mm cigarettes isobtained, and the tar content of each cigarette is measured. The sample has a mean of 19.4 mg and a standard deviation of 3.23 mg. Use a 0.05 significance level to test the claim that the mean tar content of filtered 100 mm cigarettes is less than 21.1 mg, which is the mean for unfiltered king size cigarettes. Please select all TRUE statements from those givem below.1. For this hypothesis test the P-value = .0072. There is sufficient evidence to support the claim that the mean tar content of filtered 100 mm cigarettes is less than21.1 mg.3. For this hypothesis test; H0; 1.1 H1: 21.14. For this hypothesis test the test statistic is t = -2.6325. service. php?service=cache&name=55e1f208 3

Answers: 3


Another question on Mathematics


Mathematics, 22.06.2019 01:30
What is the value of x enter your answer in the box (3x+50
Answers: 2

Mathematics, 22.06.2019 03:00
Describe how the presence of possible outliers might be identified on the following. (a) histograms gap between the first bar and the rest of bars or between the last bar and the rest of bars large group of bars to the left or right of a gap higher center bar than surrounding bars gap around the center of the histogram higher far left or right bar than surrounding bars (b) dotplots large gap around the center of the data large gap between data on the far left side or the far right side and the rest of the data large groups of data to the left or right of a gap large group of data in the center of the dotplot large group of data on the left or right of the dotplot (c) stem-and-leaf displays several empty stems in the center of the stem-and-leaf display large group of data in stems on one of the far sides of the stem-and-leaf display large group of data near a gap several empty stems after stem including the lowest values or before stem including the highest values large group of data in the center stems (d) box-and-whisker plots data within the fences placed at q1 â’ 1.5(iqr) and at q3 + 1.5(iqr) data beyond the fences placed at q1 â’ 2(iqr) and at q3 + 2(iqr) data within the fences placed at q1 â’ 2(iqr) and at q3 + 2(iqr) data beyond the fences placed at q1 â’ 1.5(iqr) and at q3 + 1.5(iqr) data beyond the fences placed at q1 â’ 1(iqr) and at q3 + 1(iqr)
Answers: 1

You know the right answer?
A simple random sample of 25 filtered 100 mm cigarettes isobtained, and the tar content of each cig...
Questions

Computers and Technology, 31.07.2019 12:00


Physics, 31.07.2019 12:00


Geography, 31.07.2019 12:00


Geography, 31.07.2019 12:00


English, 31.07.2019 12:00

English, 31.07.2019 12:00

Computers and Technology, 31.07.2019 12:10


