
SECTION B
21. The Venn diagram below shows the number of pupils who like Math (M) and
Science...

Mathematics, 28.03.2021 14:20 gg12344
SECTION B
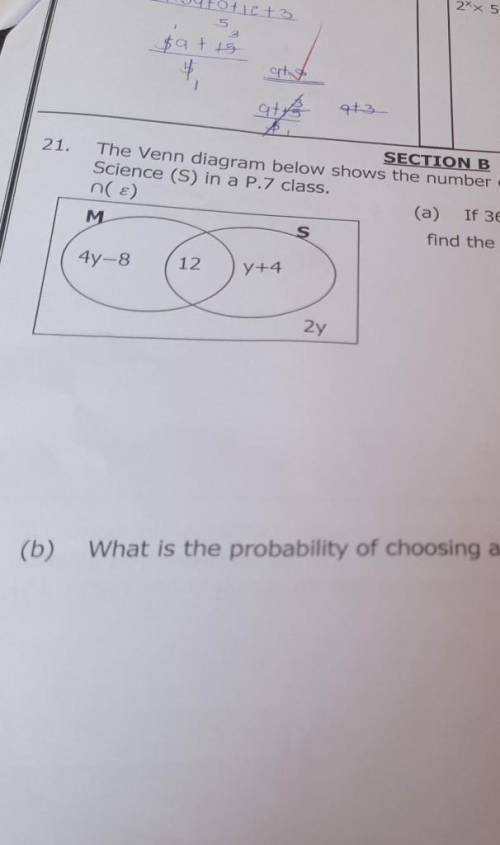
21. The Venn diagram below shows the number of pupils who like Math (M) and
Science (S) in a P.7 class.
n( €)
(a) If 36 pupils like only one subject,
M
S
find the value of y. (3marks)
44-8
12
y+4
2y
(b) What is the probability of choosing a pupil who does not like Science?
(2 marks)

Answers: 1


Another question on Mathematics
Mathematics, 21.06.2019 19:30
If the ratio of sum of the first m and n terms of an ap is m2 : n2 , show that the ratio of its mth and nth terms is (2m − 1) : (2n − 1).
Answers: 1
Mathematics, 21.06.2019 20:00
The radius of the earth is two times the radius of the moon. what fraction of the volume of the earth is the volume of the moon?
Answers: 1
Mathematics, 21.06.2019 23:00
Aremote-controlled boat can travel at 4 feet per second in calm water. the boat traveled 48 feet with the current, and then it traveled 16 feet against the current in the same amount of time. how fast is the current?
Answers: 1
You know the right answer?
Questions
Mathematics, 16.02.2021 04:20


Mathematics, 16.02.2021 04:20
Chemistry, 16.02.2021 04:20
Health, 16.02.2021 04:20

Law, 16.02.2021 04:20

World Languages, 16.02.2021 04:20

Social Studies, 16.02.2021 04:20

Mathematics, 16.02.2021 04:20


