
Mathematics, 30.03.2021 18:00 sainijasdeep27
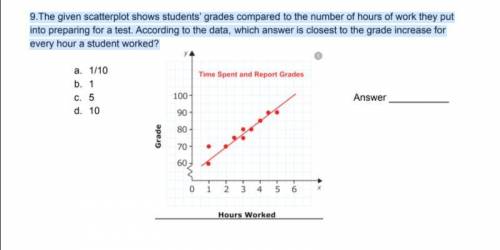
The given scatterplot shows students’ grades compared to the number of hours of work they put into preparing for a test. According to the data, which answer is closest to the grade increase for every hour a student worked?
a. 1/10
b. 1
c. 5
d. 10

Answers: 2


Another question on Mathematics
Mathematics, 21.06.2019 18:40
Christina can paint 420 square feet in 105 minutes. which unit rate describes the scenario?
Answers: 1
Mathematics, 21.06.2019 19:00
If f(x)= sqrt4x+9+2, which inequality can be used to find the domain of f(x)?
Answers: 2
Mathematics, 22.06.2019 01:10
Write each improper fraction as a mixed number. 9/4. 8/3. 23/6. 11/2. 17/5. 15/8. 33/10. 29/12.
Answers: 2
Mathematics, 22.06.2019 01:50
The area of each triangle is 7 square units. the surface area of the triangular prism is
Answers: 1
You know the right answer?
The given scatterplot shows students’ grades compared to the number of hours of work they put into p...
Questions


Computers and Technology, 29.11.2019 02:31
Computers and Technology, 29.11.2019 02:31


