
Mathematics, 31.03.2021 18:50 glowbaby123
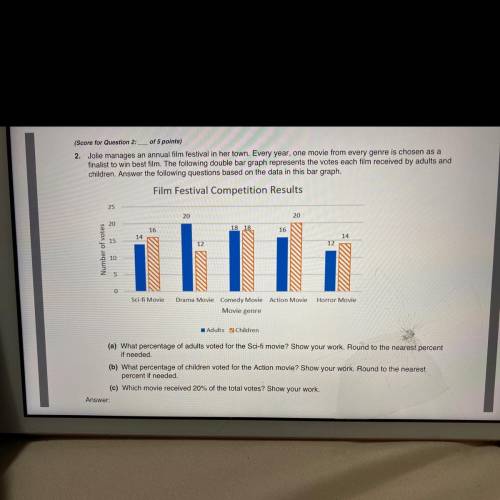
2. Jolie manages an annual film festival in her town. Every year, one movie from every genre is chosen as a
finalist to win best film. The following double bar graph represents the votes each film received by adults and
children. Answer the following questions based on the data in this bar graph.
Film Festival Competition Results
25
20
20
20
16
18 18
16
14
14
15
12
Number of votes
10
5
0
Sci-fi Movie
Horror Movie
Drama Movie Comedy Movie Action Movie
Movie genre
Adults Children
(a) What percentage of adults voted for the Sci-fi movie? Show your work. Round to the nearest percent
if needed.
(b) What percentage of children voted for the Action movie? Show your work. Round to the nearest
percent if needed.
(c) Which movie received 20% of the total votes? Show your work.

Answers: 2


Another question on Mathematics
Mathematics, 21.06.2019 19:20
Which number line represents the solution set for the inequality - x 24?
Answers: 3
Mathematics, 21.06.2019 19:40
It appears that people who are mildly obese are less active than leaner people. one study looked at the average number of minutes per day that people spend standing or walking. among mildly obese people, the mean number of minutes of daily activity (standing or walking) is approximately normally distributed with mean 376 minutes and standard deviation 64 minutes. the mean number of minutes of daily activity for lean people is approximately normally distributed with mean 528 minutes and standard deviation 107 minutes. a researcher records the minutes of activity for an srs of 7 mildly obese people and an srs of 7 lean people. use z-scores rounded to two decimal places to answer the following: what is the probability (image for it appears that people who are mildly obese are less active than leaner people. one study looked at the averag0.0001) that the mean number of minutes of daily activity of the 6 mildly obese people exceeds 420 minutes? what is the probability (image for it appears that people who are mildly obese are less active than leaner people. one study looked at the averag0.0001) that the mean number of minutes of daily activity of the 6 lean people exceeds 420 minutes?
Answers: 1
Mathematics, 21.06.2019 20:00
Evaluate the discriminant of each equation. tell how many solutions each equation has and whether the solutions are real or imaginary. x^2 - 4x - 5 = 0
Answers: 2
Mathematics, 21.06.2019 22:20
Question 4 of 10 2 points what is the second part of the process of investigating a question using data? a. rephrasing the question o b. describing the data c. collecting the data o d. making an inference submit
Answers: 1
You know the right answer?
2. Jolie manages an annual film festival in her town. Every year, one movie from every genre is chos...
Questions
Mathematics, 26.07.2019 14:00


Biology, 26.07.2019 14:00

Mathematics, 26.07.2019 14:00

Mathematics, 26.07.2019 14:00

English, 26.07.2019 14:00

Arts, 26.07.2019 14:00


