
Mathematics, 12.04.2021 04:20 brydenskl814
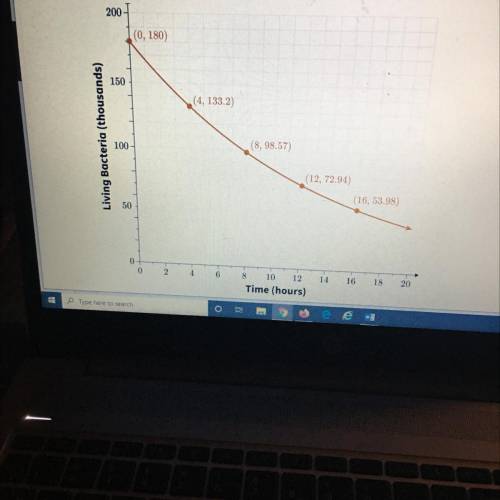
When nutrients for a bacteria culture are exhausted the bacteria culture goes through the death or decay, phase of the
bacteria growth curve The following graph shows the number of living bacteria in the colony as a function of time in hours,
after the start of the decay phase Determine the statement that correctly interprets the graph of the function
A) The number of living bacteria in the culture decreases by about 26% each hour
B) The number of living bacteria in the culture deceases by about 6.6% each hour
C) The number of living bacteria in the culture decreases by about 7.25%
D) each hour there were 133,200 living bacteria in the culture at the start of the decay phase

Answers: 1


Another question on Mathematics
Mathematics, 21.06.2019 15:30
What is the length of the missing leg in this right triangle? 18 mm 24 mm 26 mm 32 mm
Answers: 1
Mathematics, 21.06.2019 21:00
Check all that apply. f is a function. f is a one-to-one function. c is a function. c is a one-to-one function.
Answers: 3
Mathematics, 21.06.2019 22:30
What is the graph of the absolute value equation ? y=|x|-5
Answers: 1
You know the right answer?
When nutrients for a bacteria culture are exhausted the bacteria culture goes through the death or d...
Questions
Mathematics, 02.07.2020 16:01


Biology, 02.07.2020 16:01


Physics, 02.07.2020 16:01


Mathematics, 02.07.2020 16:01


