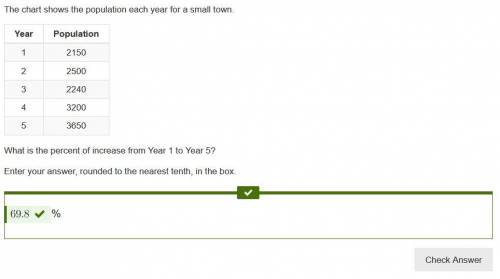
The chart shows the population each year for a small town.
year population
1 2150...

Mathematics, 28.01.2020 00:31 leo4687
The chart shows the population each year for a small town.
year population
1 2150
2 2500
3 2240
4 3200
5 3650
what is the percent of increase from year 1 to year 5?

Answers: 1


Another question on Mathematics


Mathematics, 21.06.2019 18:30
In the triangles, tr = ge and sr = fe. if = 3.2 ft, which is a possible measure of ? 1.6 ft 3.0 ft 3.2 ft 4.0 ft
Answers: 2

Mathematics, 21.06.2019 18:30
Deshawn uses 3/4 of a box of rice to cook dinner the portion he uses weighs 12 ounces right and solve an equation to find the weight of the full box of rice
Answers: 1

Mathematics, 21.06.2019 19:30
Me. i can't figure out this question. give an explanation too. .
Answers: 1
You know the right answer?
Questions


Mathematics, 20.10.2020 01:01


Health, 20.10.2020 01:01


Mathematics, 20.10.2020 01:01


Biology, 20.10.2020 01:01


English, 20.10.2020 01:01


English, 20.10.2020 01:01

English, 20.10.2020 01:01


English, 20.10.2020 01:01


