
Mathematics, 26.08.2019 17:30 victorialeona81
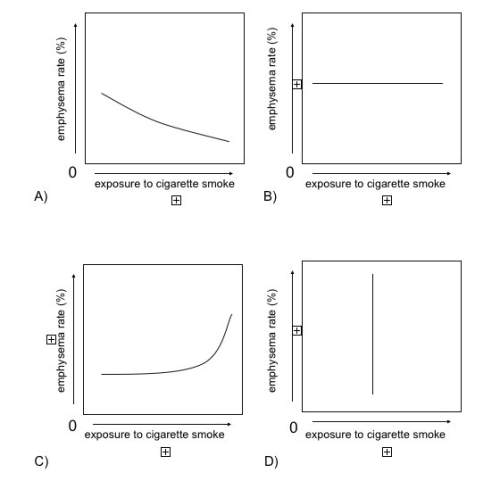
Which graph indicates that increasing exposure to cigarette smoke increases the risk of emphysema? justify your reasoning in terms of the behavior of the dependent and independent variables.
a) b: the dependent variable remains constant.
b) d; the independent variable remains constant.
c) c; as the independent variable increases, the dependent variable increases.
d) a; as the independent variable increases, the dependent variable decreases.
in the picture

Answers: 1


Another question on Mathematics
Mathematics, 21.06.2019 15:00
Answer this question only if you know the 30 points and
Answers: 1
Mathematics, 21.06.2019 15:50
Assemble the proof by dragging tiles to the statements and reasons column
Answers: 2
Mathematics, 21.06.2019 23:00
What is the location of point g, which partitions the directed line segment from d to f into a 5: 4 ratio? –1 0 2 3
Answers: 1
Mathematics, 22.06.2019 01:00
Which of the following values in the set below will make the equation 5x + 6 = 6 true? (only input the number.) {0, 1, 2, 3, 4}
Answers: 2
You know the right answer?
Which graph indicates that increasing exposure to cigarette smoke increases the risk of emphysema?...
Questions

Computers and Technology, 03.02.2021 16:10

Mathematics, 03.02.2021 16:10
Mathematics, 03.02.2021 16:10


Social Studies, 03.02.2021 16:10
Mathematics, 03.02.2021 16:10

Social Studies, 03.02.2021 16:10

Chemistry, 03.02.2021 16:10


