
Mathematics, 21.10.2019 16:30 ksawyer745
The table below represents a function. which statement would best describe the graph of the function
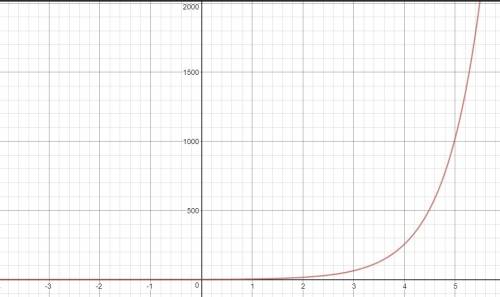
x 1 2 3 4. 5
y 1 16 64 256 1,024
a. the graph is a straight line that has a slope of 8
b. the grqph is a horizontal line at y=16
c. the graph starts flat but curves steeply upward
d. the graph is a parsbola that opens upward

Answers: 1
 .
.


Another question on Mathematics
Mathematics, 21.06.2019 13:50
Astudent received the following grades last semester. find the student's semester grade point average. an a is algebra (3 credits), a b in history ( 3 credits), a in sociology ( 3 credits) a d in english ( 3credits) and a c in seminar ( 2credits). an a is worth 4 points, a b is worth 3 points a c is worth 2 points and a d is worth 1 point.
Answers: 2
Mathematics, 21.06.2019 15:30
Which is the length of the hypotenuse of the triangle a. 94ft b. 214 ft c. 33ft d. 37 ft
Answers: 1
Mathematics, 21.06.2019 16:00
Awall map has a scale of 128 miles = 6 inches. the distance between springfield and lakeview is 2 feet on the map. what is the actual distance between springfield and lakeview? 384 miles 512 miles 1.13 miles 42.7 miles
Answers: 1
You know the right answer?
The table below represents a function. which statement would best describe the graph of the function...
Questions

Physics, 30.07.2019 12:30


Social Studies, 30.07.2019 12:30

Business, 30.07.2019 12:30
History, 30.07.2019 12:30
Social Studies, 30.07.2019 12:30
Physics, 30.07.2019 12:30
English, 30.07.2019 12:30
Mathematics, 30.07.2019 12:30
Biology, 30.07.2019 12:30


