
Mathematics, 05.01.2020 14:31 lovemusic4
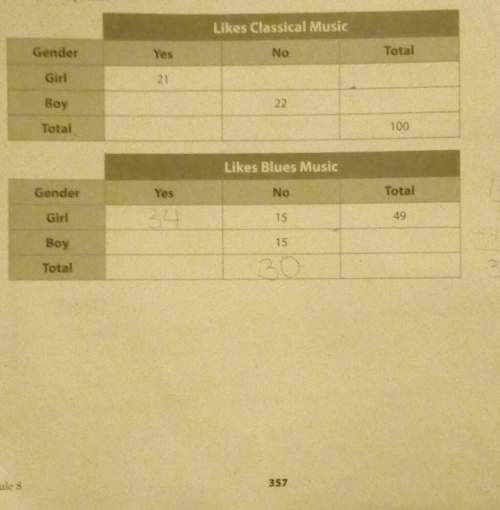
Shown are two different tables about a survey involving students. each survey has a few questions about musical preferences. all students answered all questions. complete the tables. what type of music do the students prefer?

Answers: 3


Another question on Mathematics
Mathematics, 21.06.2019 20:00
Mario has $14.35 left in his wallet. he spent $148.43 for tablecloths. then, he spent $92.05 for napkins. how much money did mario have in his wallet to start with?
Answers: 2
Mathematics, 21.06.2019 22:00
Asales representative from a local radio station is trying to convince the owner of a small fitness club to advertise on her station. the representative says that if the owner begins advertising on the station today, the club's total number of members will grow exponentially each month. she uses the given expression to model the number of club members, in hundreds, after advertising for t months.
Answers: 2
Mathematics, 21.06.2019 23:50
The federal reserve controls certain interest rates in the united states. investors often try to speculate as to whether the federal reserve will raise or lower rates and by how much. suppose a company conducts extensive interviews with financial analysts, and as a result, predicts that "thefed" will increase rates by an average of 0.25 percentage points every six months for the forseeable future. which type of equation could be used to model the predicted interest rates over the next several years, assuming no other significant changes? a) a linear equation b) a quadratic equation c) a polynomial equation d) an exponential equation
Answers: 3
Mathematics, 22.06.2019 02:30
Atrain traveled for 1.5 hours to the first station, stopped for 30 minutes, then traveled for 4 hours to the final station where it stopped for 1 hour. the total distance traveled is a function of time. which graph most accurately represents this scenario? a graph is shown with the x-axis labeled time (in hours) and the y-axis labeled total distance (in miles). the line begins at the origin and moves upward for 1.5 hours. the line then continues upward at a slow rate until 2 hours. from 2 to 6 hours, the line continues quickly upward. from 6 to 7 hours, it moves downward until it touches the x-axis a graph is shown with the axis labeled time (in hours) and the y axis labeled total distance (in miles). a line is shown beginning at the origin. the line moves upward until 1.5 hours, then is a horizontal line until 2 hours. the line moves quickly upward again until 6 hours, and then is horizontal until 7 hours a graph is shown with the axis labeled time (in hours) and the y-axis labeled total distance (in miles). the line begins at the y-axis where y equals 125. it is horizontal until 1.5 hours, then moves downward until 2 hours where it touches the x-axis. the line moves upward until 6 hours and then moves downward until 7 hours where it touches the x-axis a graph is shown with the axis labeled time (in hours) and the y-axis labeled total distance (in miles). the line begins at y equals 125 and is horizontal for 1.5 hours. the line moves downward until 2 hours, then back up until 5.5 hours. the line is horizontal from 5.5 to 7 hours
Answers: 1
You know the right answer?
Shown are two different tables about a survey involving students. each survey has a few questions ab...
Questions

History, 22.07.2019 14:00
Mathematics, 22.07.2019 14:00
Mathematics, 22.07.2019 14:00

Biology, 22.07.2019 14:00


Mathematics, 22.07.2019 14:00

Biology, 22.07.2019 14:00
History, 22.07.2019 14:00
History, 22.07.2019 14:00
Biology, 22.07.2019 14:00
History, 22.07.2019 14:00
Mathematics, 22.07.2019 14:00
History, 22.07.2019 14:00


